Plastic Ceiling
Total revolving consumer credit outstanding
What is the current Plastic Ceiling reading?
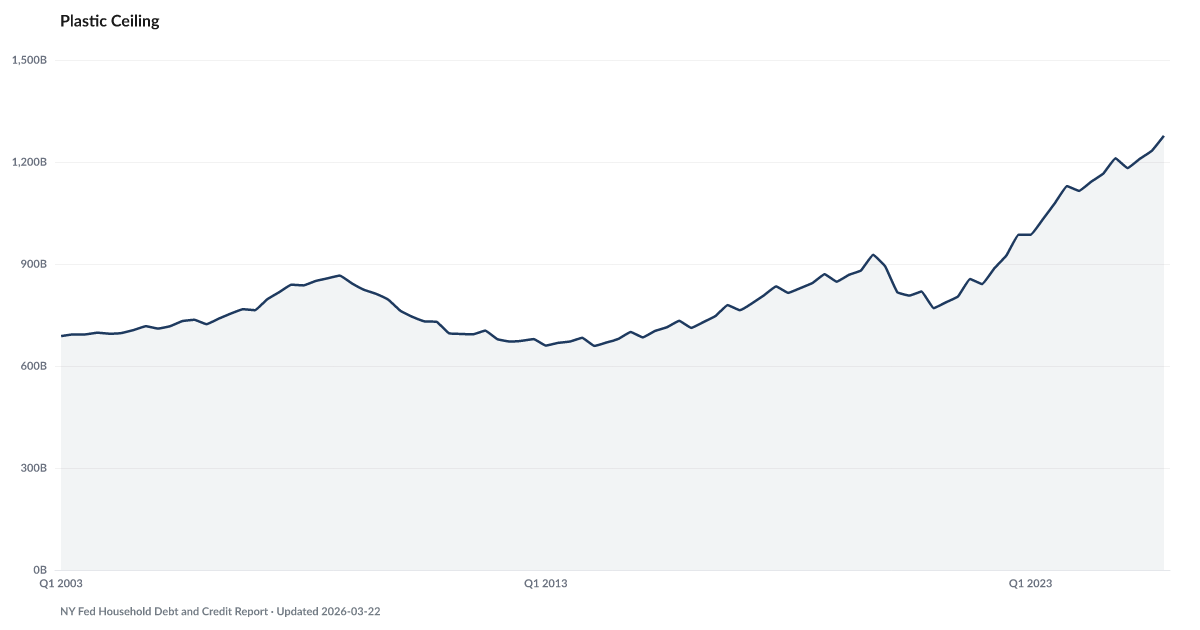
Total U.S. credit card debt stood at $1.26 trillion in Q2 2026, according to the New York Fed's Household Debt and Credit Report. Balances have climbed from $856 billion at the end of 2021 — among the fastest credit card debt accumulation on record. Source: Federal Reserve Bank of New York Household Debt and Credit Report (Q2 2026).
Credit card debt sits below its record high, while carrying that debt remains expensive.
Total credit card balances reached $1.26 trillion in Q2 2026, according to the New York Fed's Household Debt and Credit Report — below the all-time high after a seasonal paydown. Balances have climbed from $856 billion at the end of 2021 to current levels, even with the typical Q1 seasonal dip each year. The accumulation since 2021 is unusually steep in the site series.
What makes this buildup different from previous periods is the cost of carrying it. The Card Tax shows the average credit card APR still elevated in the Federal Reserve series. At that rate, a household carrying the average balance pays over a thousand dollars per year in interest alone — money that services debt rather than building savings or covering expenses.
The downstream effects are already visible. Falling Behind shows total delinquency back at pre-pandemic levels, and The Buffer tracks personal saving, another resource households can use to pay down balances. Elevated debt at elevated interest rates with depleted savings is a combination that hasn't appeared in the data before.
Explore Further
Is this happening to you?
Is your total credit card balance higher than it was a year ago?
How has Plastic Ceiling changed over time?

Most affected counties
Counties with the highest safety net and buffer scores in the County Distress Index.
Explore all 3,144 counties →| Period | Value | YoY Change |
|---|---|---|
| Q2 2026 | $1.263T | +$54B |
| Q1 2026 | $1.242T | +$60B |
| Q4 2025 | $1.277T | +$66B |
| Q3 2025 | $1.233T | +$67B |
| Q2 2025 | $1.209T | +$67B |
| Q1 2025 | $1.182T | +$67B |
| Q4 2024 | $1.211T | +$82B |
| Q3 2024 | $1.166T | +$87B |
| Q2 2024 | $1.142T | +$111B |
| Q1 2024 | $1.115T | +$129B |
| Q4 2023 | $1.129T | +$143B |
| Q3 2023 | $1.079T | +$154B |
Frequently Asked Questions
How much credit card debt do Americans owe?
Americans owed $1.26 trillion in credit card debt as of Q2 2026, according to the New York Fed's Household Debt and Credit Report, having risen from $856 billion at the end of 2021.
How fast is credit card debt growing?
Credit card balances have climbed from $856 billion at the end of 2021 to $1.26 trillion in Q2 2026 — among the fastest accumulation on record.
Why is record credit card debt a problem now?
What makes the current buildup different from previous periods is the cost of carrying it. The average credit card APR stands at 20.94% in Q2 2026, near the series record of 21.76% set in Q3 2024. At that rate, a household carrying the average balance pays over $1,000 per year in interest alone — money that services debt rather than covering expenses or building savings.
How much of credit card debt is delinquent?
Total delinquency across all consumer debt is 4.73% as of Q2 2026, across every loan type the NY Fed tracks. For credit cards specifically, banks outside the 100 largest report 6.43% as of Q1 2026, against 2.92% for the whole commercial-bank aggregate those smaller banks are counted inside.
Where does the credit card debt data come from?
The New York Fed's Quarterly Report on Household Debt and Credit provides total credit card balance data based on a nationally representative sample from Equifax consumer credit reports. It is released approximately two months after each quarter ends.


Quick poll
Is this affecting you or your household?
Discussion
Get the numbers when they move.
New data drops, indicator updates, and ADI score changes — delivered when it matters. No spam.
or Create an Account for full access
Loading comments…