The 60-Day Line
Credit card balances 60+ days delinquent
What is the current 60-Day Line reading?
Equifax Bankcard Balance Delinquency Rate (60+ DPD): 2.71% as of 2026-06. Source: Equifax Monthly Press Release.
Measurement basis: Share of bankcard balances that are 60 or more days past due in Equifax's monthly U.S. National Consumer Credit Trends Portfolio report. This is a balance-level bankcard rate, not a share of accounts or borrowers and not an auto-loan measure.
2.71% of bank card balances were 60 or more days past due in June 2026, on Equifax data.
Thirty days late is a mistake. Sixty days late is a pattern.
That is the line Equifax tracks — the share of bank card balances where a single missed payment has become two, where the servicer's autodialer starts and the late fees compound on the late fees. As of June 2026 the rate sat at 2.71%.
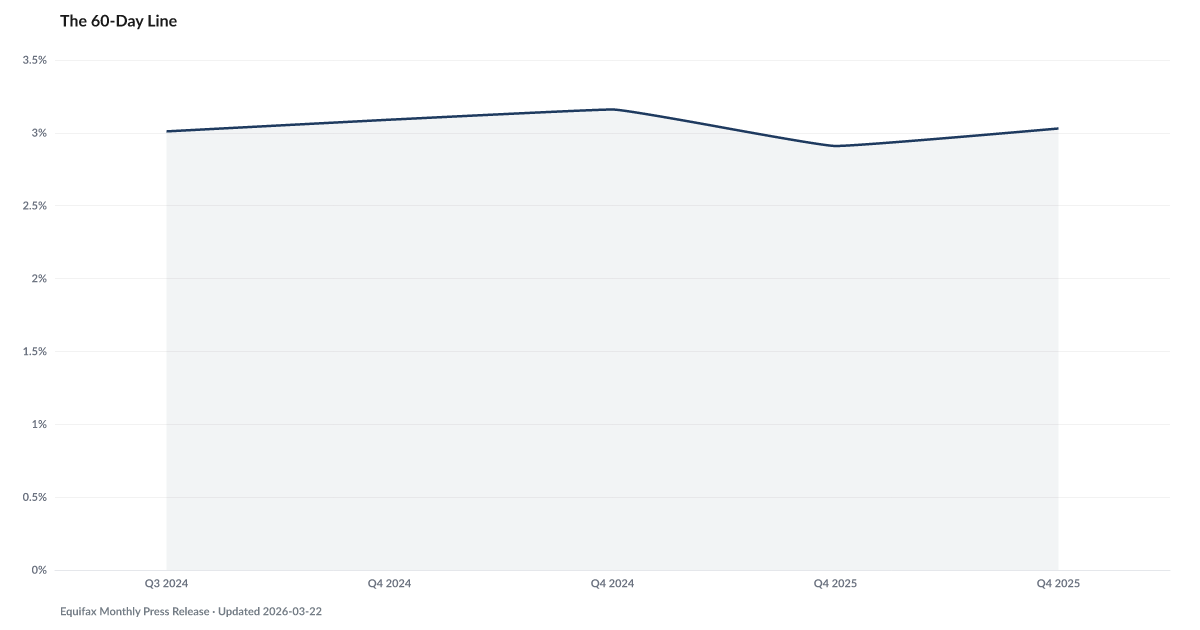
Equifax's 60-day series begins in September 2024 and does not publish on a steady monthly cadence, so this page carries only a handful of readings. That is too few, and too unevenly spaced, to describe a direction. Longer history for card delinquency has to come from the broader Federal Reserve series behind Credit Card Delinquency, which is measured differently and cannot be spliced onto this one.
The next station down the pipeline is Credit Card Charge-Offs, where the bank declares the balance uncollectable and writes it off as a loss. Sixty days is the bridge between the two.
Explore Further
Is this happening to you?
Have any of your accounts gone 60 or more days past due?
How has The 60-Day Line changed over time?

Most affected counties
Counties with the highest delinquency scores in the County Distress Index.
Explore all 3,144 counties →| Period | Value | YoY Change |
|---|---|---|
| Jun 2026 | 2.71% | — |
| Dec 2025 | 3.03% | -0.13 pp |
| Oct 2025 | 2.91% | -0.18 pp |
| Dec 2024 | 3.16% | — |
| Oct 2024 | 3.09% | — |
| Sep 2024 | 3.01% | — |
Frequently Asked Questions
What is Equifax Bankcard Balance Delinquency Rate (60+ DPD)?
Credit card balances 60+ days delinquent
Why does Equifax Bankcard Balance Delinquency Rate (60+ DPD) matter for financial distress?
Equifax Bankcard Balance Delinquency Rate (60+ DPD) is one of the indicators tracked by the American Distress Index (ADI), which measures five dimensions of U.S. household financial distress: Delinquency, Default & Legal, Debt Burden, Labor, and Safety Net & Buffer. Changes in this indicator contribute to the overall distress picture.
Where does the Equifax Bankcard Balance Delinquency Rate (60+ DPD) data come from?
This data comes from Equifax Monthly Press Release. More information: https://www.equifax.com/resource/-/asset/report/monthly-national-consumer-credit-trends-report-july-2026-portfolio/. The American Distress Index updates this indicator monthly.


Quick poll
Is this affecting you or your household?
Discussion
Get the numbers when they move.
New data drops, indicator updates, and ADI score changes — delivered when it matters. No spam.
or Create an Account for full access
Loading comments…