Part-Time for Economic Reasons
Workers in part-time jobs who want full-time work
Historically follows Initial Unemployment Claims (SA) by 1 quarter — no active signal. Initial Unemployment Claims (SA) · View projections
What is the current Part-Time for Economic Reasons?
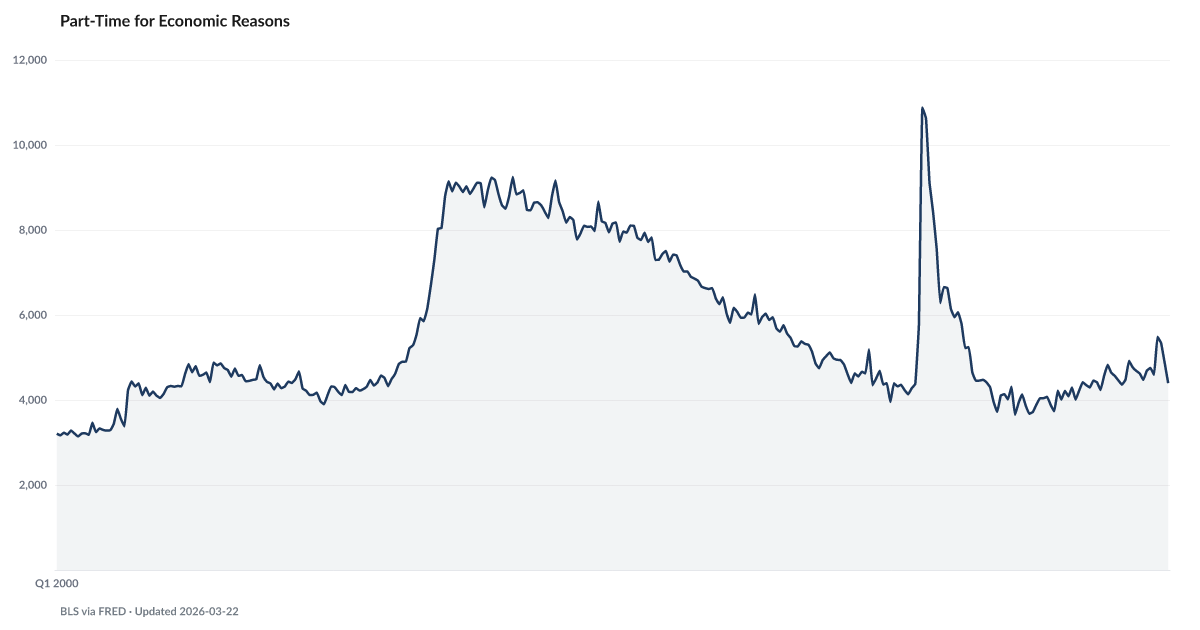
4.4 million Americans are working part-time for economic reasons — they want full-time work but can't find it or had hours cut. This measure of labor market underutilization captures hidden unemployment that headline numbers miss. Source: BLS via FRED (LNS12032194).
Several million Americans are working part-time because they cannot find full-time work — a measure of labor-market slack the headline unemployment rate does not capture.
The BLS Current Population Survey asks part-time workers why they are part-time. The ones who answer that they would prefer full-time hours but cannot get them are counted as working part-time for economic reasons. That count remains well above the 2022 low around 3.65 million and the 2023 low near 3.73 million, even after pulling back from elevated 2024 readings.
Involuntary part-time work is underemployment rather than unemployment. The worker has income, just not the income they want, or the hours the household budget was built around. It is the kind of slack the headline Unemployment Rate misses entirely, which is why the broader U-6 Underemployment Rate runs well above the U-3 reading.
The financial mechanics of involuntary part-time work compound quickly. A major hours cut means a major income cut, and most household fixed costs — rent, auto loan, insurance — do not adjust. A worker who drops from 40 hours to 25 sees their entire budget restructured around a shortfall that did not exist the month before. That is where The Buffer starts to drain and where the first missed payments in Falling Behind tend to appear.
The persistent gap above the 2022-2023 baseline represents real households carrying real shortfalls. The headline unemployment rate can hold near 4% while this series climbs, because part-time workers still count as employed. The statistic counts them that way by design. That is also why the part-time-for-economic-reasons series belongs on any honest distress dashboard.
Explore Further
How has Part-Time for Economic Reasons changed over time?

Most affected counties
Counties with the highest labor scores in the County Distress Index.
Explore all 3,144 counties →| Period | Value | YoY Change |
|---|---|---|
| May 2026 | 4,805 | +181.00 |
| Apr 2026 | 4,942 | +256.00 |
| Mar 2026 | 4,497 | −274.00 |
| Feb 2026 | 4,396 | −527.00 |
| Jan 2026 | 4,873 | +395.00 |
| Dec 2025 | 5,341 | +980.00 |
| Nov 2025 | 5,487 | +1024.00 |
| Sep 2025 | 4,594 | −49.00 |
| Aug 2025 | 4,755 | −73.00 |
| Jul 2025 | 4,689 | +120.00 |
| Jun 2025 | 4,473 | +237.00 |
| May 2025 | 4,624 | +208.00 |
Frequently Asked Questions
What does 'part-time for economic reasons' mean?
This counts workers who want full-time jobs but are stuck in part-time positions because of slack business conditions or inability to find full-time work. At 4.4 million, it signals significant hidden underemployment.
Why does involuntary part-time work matter?
Part-time workers earn less, often lack benefits, and struggle to cover fixed expenses like rent and debt payments. Rising involuntary part-time work is a leading indicator of broader financial distress.
Where does this data come from?
Published monthly by the Bureau of Labor Statistics as part of the Current Population Survey, available via FRED series LNS12032194.

Quick poll
Is this affecting you or your household?
Discussion
Get the numbers when they move.
New data drops, indicator updates, and ADI score changes — delivered when it matters. No spam.
or Create an Account for full access
Loading comments…