Financial Obligations Ratio
Household financial obligations as share of income
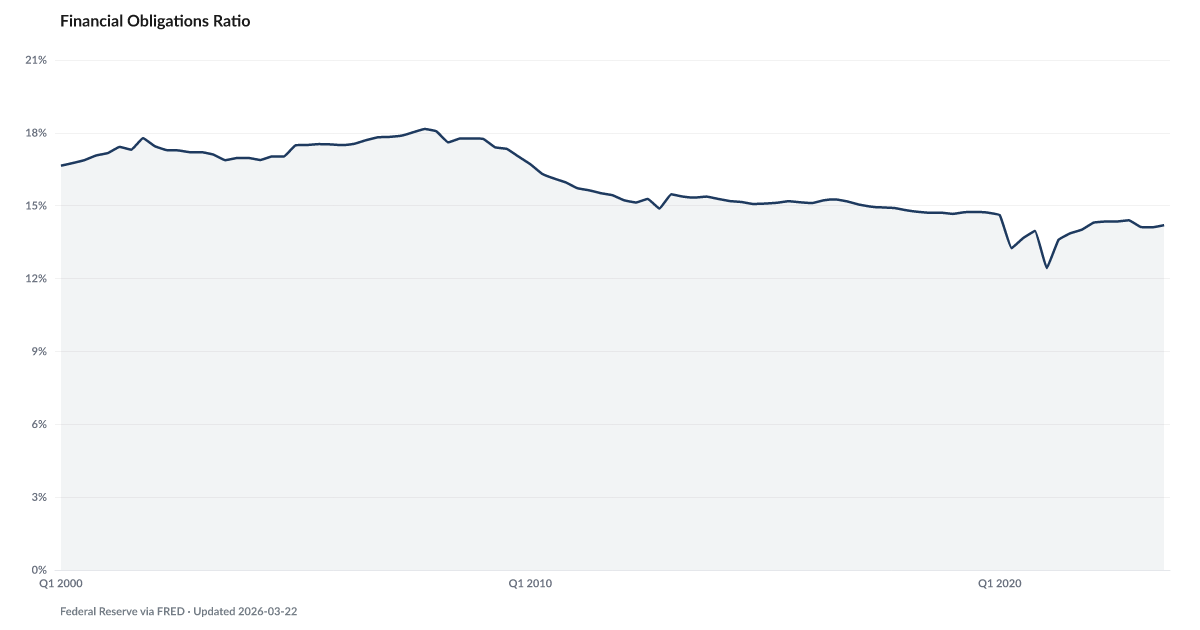
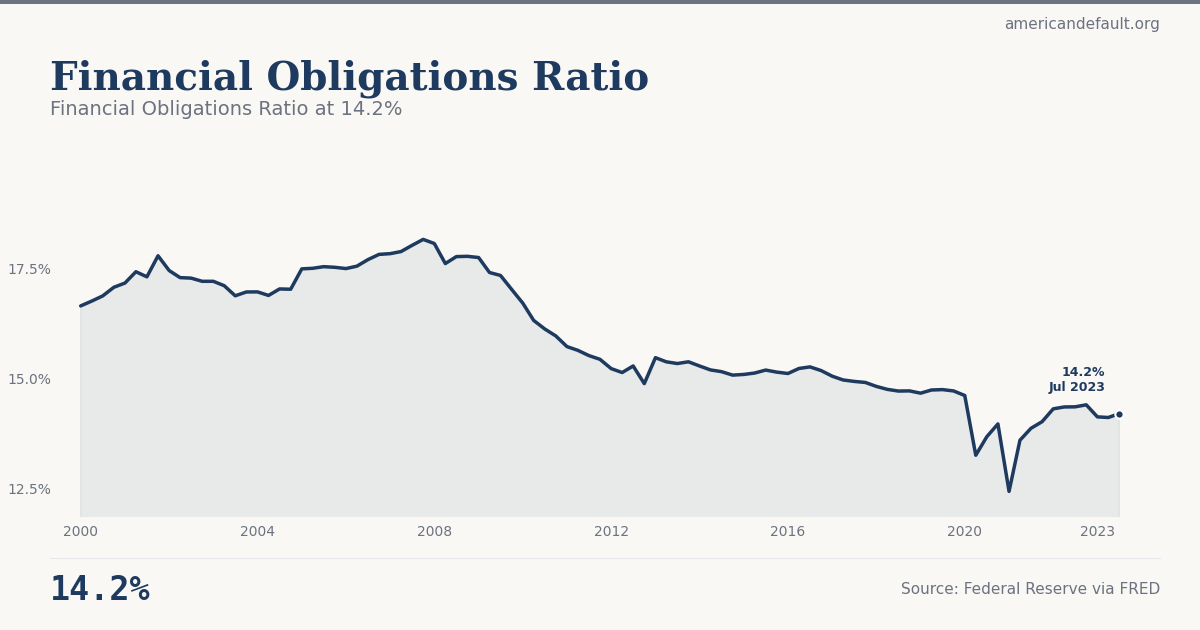
What is the current Financial Obligations Ratio?
The household financial obligations ratio measures total required monthly payments — debt service plus rent, auto leases, homeowner insurance, and property taxes — as a share of disposable income. This broader measure captures financial commitments that the standard debt service ratio misses. Source: Federal Reserve via FRED.
Financial Obligations Ratio at 14.2%
Tracking stable relative to recent baseline.
Explore Further
How has Financial Obligations Ratio changed over time?

| Period | Value | YoY Change |
|---|---|---|
| Q3 2023 | 14.2% | −0.2 pts |
| Q2 2023 | 14.11% | −0.2 pts |
| Q1 2023 | 14.12% | −0.2 pts |
| Q4 2022 | 14.4% | +0.4 pts |
| Q3 2022 | 14.35% | +0.5 pts |
| Q2 2022 | 14.35% | +0.8 pts |
| Q1 2022 | 14.31% | +1.9 pts |
| Q4 2021 | 14.01% | +0.1 pts |
| Q3 2021 | 13.86% | +0.2 pts |
| Q2 2021 | 13.59% | +0.3 pts |
| Q1 2021 | 12.43% | −2.2 pts |
| Q4 2020 | 13.96% | −0.7 pts |
Frequently Asked Questions
What is the financial obligations ratio?
The financial obligations ratio measures total required household payments — including debt service, rent, auto leases, homeowner insurance, and property taxes — as a share of disposable personal income. It is a broader measure than the household debt service ratio, which only counts debt payments.
How does this differ from the debt service ratio?
The debt service ratio counts only debt payments (mortgage, credit card, auto loan, student loan). The financial obligations ratio adds rent payments, auto lease payments, homeowner insurance, and property taxes. This gives a more complete picture of fixed monthly costs that households cannot easily reduce.
Where does the financial obligations data come from?
The Federal Reserve publishes the financial obligations ratio quarterly, based on estimates of total required household payments divided by disposable personal income. It is available on FRED alongside the standard debt service ratio.
Quick poll
Is this affecting you or your household?
Discussion
Get the numbers when they move.
New data drops, indicator updates, and ADI score changes — delivered when it matters. No spam.
or Create an Account for full access
Loading comments…