Chapter 7 Bankruptcy Filings (YoY % Change)
Year-over-year change in Chapter 7 bankruptcy filings
What is the current Chapter 7 Bankruptcy Filings (YoY % Change)?
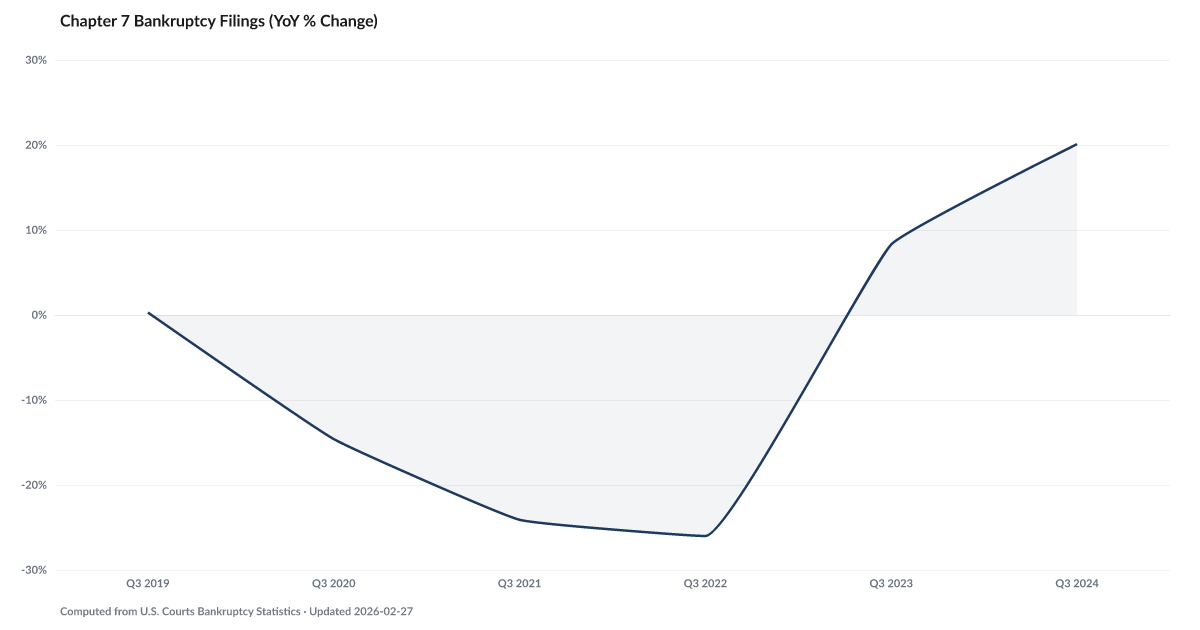
Chapter 7 bankruptcy filings — the liquidation type where debtors surrender assets to eliminate debt — rose 15.3% year-over-year in the latest reading. Chapter 7 is the 'last resort' bankruptcy for households with no repayment capacity, making its growth a signal of severe financial distress beyond what loan modifications or payment plans can address. Source: American Bankruptcy Institute / Epiq.
Chapter 7 filings moved 15.3% in fiscal 2024, accelerating from 8.3% the prior year and outpacing the Chapter 13 repayment pathway.
Chapter 7 is the bankruptcy people file when the math no longer works.
There is no repayment plan. Non-exempt assets get liquidated by the trustee. Qualifying unsecured debt — credit cards, medical bills, personal loans — gets discharged. It's the option that says: the house is gone or was never there, the income can't support a plan, and the only path forward is to erase what can be erased and start over.
U.S. Courts data show Chapter 7 filings moved 15.3% in fiscal 2024, accelerating from 8.3% the prior year and well above the 10.0% growth in Chapter 13 Filings. The shift matters because it captures a composition change underneath the headline bankruptcy numbers: more households are crossing into total liquidation rather than attempting a payment plan.
Current filings sit closer to the pre-pandemic range than to the suppressed 2020-2021 period. The distress feeding it is visible upstream — Credit Card Delinquency still above pre-pandemic norms, Credit Card Charge-Offs at an elevated post-2011 pace, and Auto Delinquency back in the pressure stack.
Explore Further
Is this happening to you?
Have you thought about whether bankruptcy might be the right choice for your situation?
How has Chapter 7 Bankruptcy Filings (YoY % Change) changed over time?

Most affected counties
Counties with the highest default and legal scores in the County Distress Index.
Explore all 3,144 counties →| Period | Value | YoY Change |
|---|---|---|
| Q1 2026 | 15.3% | −2.6 pts |
| Q4 2025 | 14.8% | −4.1 pts |
| Q3 2025 | 15.5% | −4.6 pts |
| Q2 2025 | 17% | −2.2 pts |
| Q1 2025 | 17.9% | — |
| Q4 2024 | 18.9% | — |
| Q3 2024 | 20.1% | — |
| Q2 2024 | 19.2% | — |
Frequently Asked Questions
How fast are Chapter 7 filings growing?
Chapter 7 bankruptcy filings increased 15.3% year-over-year in the latest data, indicating accelerating financial distress among households with no ability to repay debts.
What is Chapter 7 bankruptcy?
Chapter 7 is liquidation bankruptcy — debtors surrender non-exempt assets and most debts are discharged. It is chosen by households too financially distressed to enter a repayment plan (Chapter 13).
Where does this data come from?
Published by the American Bankruptcy Institute based on Epiq court filing data, tracked monthly.

Quick poll
Is this affecting you or your household?
Discussion
Get the numbers when they move.
New data drops, indicator updates, and ADI score changes — delivered when it matters. No spam.
or Create an Account for full access
Loading comments…