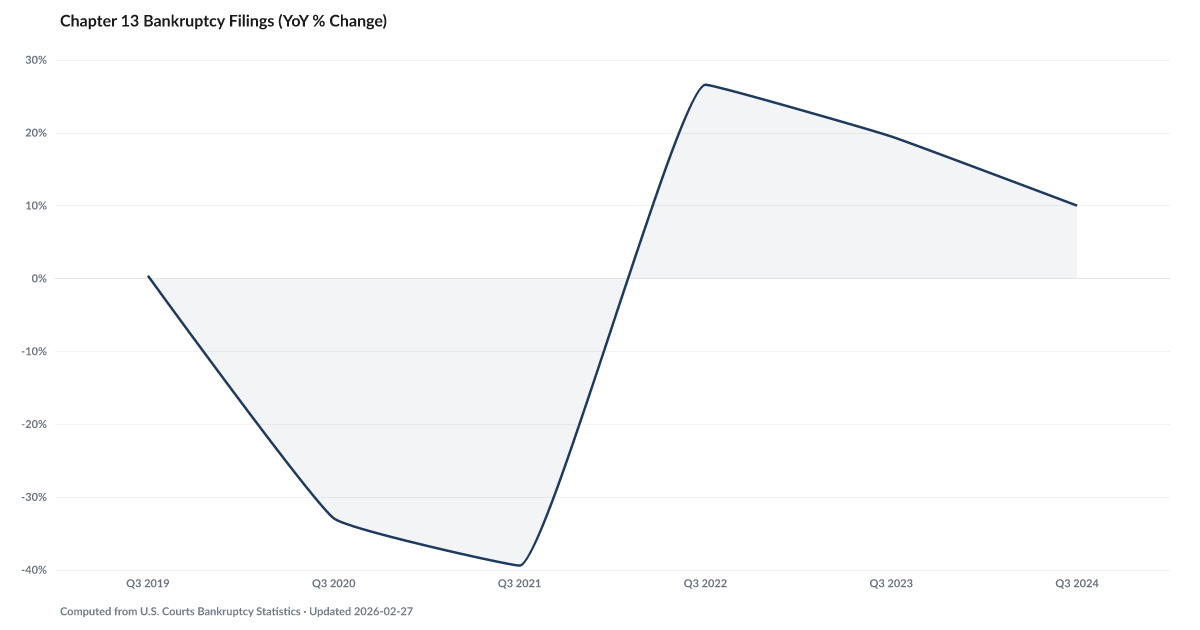
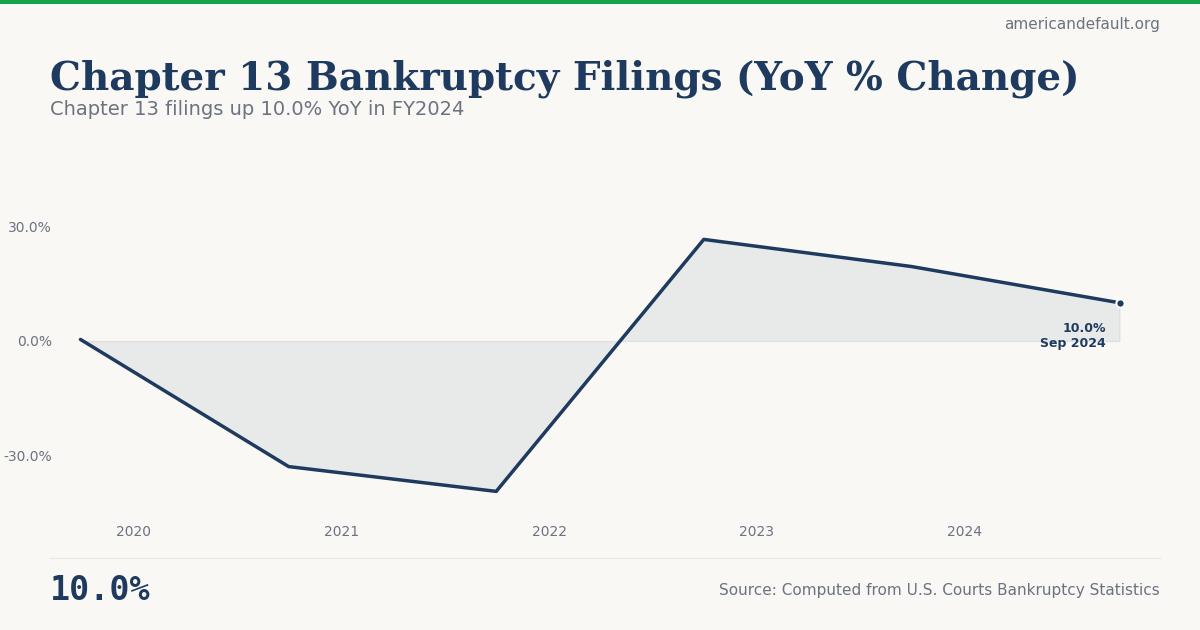
Chapter 13 Bankruptcy Filings (YoY % Change)
10% — down from 19.5% a year ago; growth slowing as Chapter 7 surges instead
What is the current Chapter 13 Bankruptcy Filings (YoY % Change)?
Chapter 13 bankruptcy filings — the repayment plan type — rose 10.0% year-over-year in the latest reading. Chapter 13 allows homeowners to catch up on mortgage arrears over 3-5 years while keeping their home. Rising filings signal that more households need court protection to restructure debts, even though they have some income to make payments. Source: American Bankruptcy Institute / Epiq.
Chapter 13 filings up 10.0% YoY in FY2024
Chapter 13 repayment plans rising as pandemic relief expires and debt levels grow.
Explore Further
Is this happening to you?
Have you considered a repayment plan to catch up on what you owe?
How has Chapter 13 Bankruptcy Filings (YoY % Change) changed over time?

| Period | Value | YoY Change |
|---|---|---|
| Q3 2024 | 10% | −9.5 pts |
| Q3 2023 | 19.5% | −7.1 pts |
| Q3 2022 | 26.6% | +66.0 pts |
| Q3 2021 | -39.4% | −6.5 pts |
| Q3 2020 | -32.9% | −33.3 pts |
| Q3 2019 | 0.4% | — |
Frequently Asked Questions
How fast are Chapter 13 filings growing?
Chapter 13 bankruptcy filings increased 10.0% year-over-year in the latest data. While growing slower than Chapter 7, the increase signals rising need for court-supervised debt restructuring.
What is Chapter 13 bankruptcy?
Chapter 13 is a repayment plan bankruptcy where debtors propose a 3-5 year payment plan to catch up on debts while keeping assets like their home. It is commonly used to stop foreclosure.
Where does this data come from?
Published by the American Bankruptcy Institute based on Epiq court filing data, tracked monthly.
Quick poll
Is this affecting you or your household?
Discussion
Get the numbers when they move.
New data drops, indicator updates, and ADI score changes — delivered when it matters. No spam.
or Create an Account for full access
Loading comments…