North Carolina County Distress Index
Financial distress scores for all 100 counties in North Carolina, scored 0–100 across five domains. Mean score: 55.9. 21counties are in Serious Stress or Crisis.
Data: Census, BLS, Urban Institute, HUD, US Courts | Scores as of 2026-03-17
North Carolina Snapshot
North Carolina County Map
Loading interactive map…
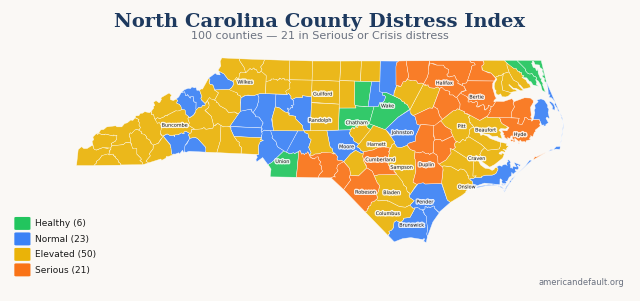
All 100 North Carolina counties colored by distress zone. Hover for details; click released counties for full reports.
Most & Least Distressed
Most Distressed
Least Distressed
Score Distribution
How North Carolina's 100 county scores are distributed across the 0–100 scale.
All North Carolina Counties
100 counties ranked by distress score. Click column headers to sort.
| State Rank | Nat'l Rank | County | Score | Zone | Primary Driver |
|---|---|---|---|---|---|
| 1 | 25 | Halifax County | 77.3 | Serious Stress | Income & Poverty |
| 2 | 28 | Bertie County | 77.1 | Serious Stress | Income & Poverty |
| 3 | 32 | Scotland County | 76.8 | Serious Stress | Income & Poverty |
| 4 | 41 | Robeson County | 76.3 | Serious Stress | Income & Poverty |
| 5 | 47 | Vance County | 76.1 | Serious Stress | Income & Poverty |
| 6 | 52 | Edgecombe County | 75.8 | Serious Stress | Income & Poverty |
| 7 | 56 | Anson County | 75.5 | Serious Stress | Income & Poverty |
| 8 | 78 | Hertford County | 74.4 | Serious Stress | Income & Poverty |
| 9 | 87 | Hyde County | 73.7 | Serious Stress | Income & Poverty |
| 10 | 117 | Warren County | 72.4 | Serious Stress | Income & Poverty |
| 11 | 132 | Northampton County | 72.0 | Serious Stress | Income & Poverty |
| 12 | 141 | Washington County | 71.6 | Serious Stress | Income & Poverty |
| 13 | 169 | Greene County | 70.9 | Serious Stress | Income & Poverty |
| 14 | 173 | Martin County | 70.8 | Serious Stress | Income & Poverty |
| 15 | 281 | Richmond County | 68.6 | Serious Stress | Income & Poverty |
| 16 | 300 | Wilson County | 68.3 | Serious Stress | Income & Poverty |
| 17 | 301 | Lenoir County | 68.2 | Serious Stress | Income & Poverty |
| 18 | 383 | Wayne County | 66.9 | Serious Stress | Debt & Delinquency |
| 19 | 391 | Duplin County | 66.8 | Serious Stress | Income & Poverty |
| 20 | 454 | Tyrrell County | 65.8 | Serious Stress | Income & Poverty |
| 21 | 461 | Cumberland County | 65.7 | Serious Stress | Housing Cost Burden |
| 22 | 503 | Jones County | 64.9 | Elevated | Debt & Delinquency |
| 23 | 508 | Pasquotank County | 64.8 | Elevated | Housing Cost Burden |
| 24 | 527 | Columbus County | 64.6 | Elevated | Income & Poverty |
| 25 | 533 | Rutherford County | 64.5 | Elevated | Community Vulnerability |
| 26 | 606 | Hoke County | 63.3 | Elevated | Community Vulnerability |
| 27 | 617 | Bladen County | 63.1 | Elevated | Income & Poverty |
| 28 | 637 | Burke County | 62.7 | Elevated | Community Vulnerability |
| 29 | 655 | Pitt County | 62.5 | Elevated | Debt & Delinquency |
| 30 | 736 | Beaufort County | 61.2 | Elevated | Income & Poverty |
| 31 | 750 | Randolph County | 61.0 | Elevated | Community Vulnerability |
| 32 | 757 | Sampson County | 61.0 | Elevated | Income & Poverty |
| 33 | 798 | Cleveland County | 60.5 | Elevated | Debt & Delinquency |
| 34 | 802 | Alleghany County | 60.5 | Elevated | Income & Poverty |
| 35 | 809 | Gaston County | 60.4 | Elevated | Housing Cost Burden |
| 36 | 851 | Chowan County | 59.7 | Elevated | Housing Cost Burden |
| 37 | 854 | Nash County | 59.7 | Elevated | Debt & Delinquency |
| 38 | 862 | Graham County | 59.6 | Elevated | Community Vulnerability |
| 39 | 865 | Perquimans County | 59.6 | Elevated | Community Vulnerability |
| 40 | 957 | Wilkes County | 58.4 | Elevated | Income & Poverty |
| 41 | 967 | Onslow County | 58.3 | Elevated | Housing Cost Burden |
| 42 | 980 | Caswell County | 58.1 | Elevated | Debt & Delinquency |
| 43 | 981 | Rockingham County | 58.1 | Elevated | Community Vulnerability |
| 44 | 1,035 | Clay County | 57.5 | Elevated | Community Vulnerability |
| 45 | 1,039 | Caldwell County | 57.5 | Elevated | Community Vulnerability |
| 46 | 1,070 | Craven County | 57.2 | Elevated | Income & Poverty |
| 47 | 1,081 | Gates County | 57.0 | Elevated | Debt & Delinquency |
| 48 | 1,107 | Person County | 56.5 | Elevated | Debt & Delinquency |
| 49 | 1,120 | Cherokee County | 56.3 | Elevated | Community Vulnerability |
| 50 | 1,170 | Pamlico County | 55.6 | Elevated | Community Vulnerability |
| 51 | 1,201 | Swain County | 55.1 | Elevated | Community Vulnerability |
| 52 | 1,233 | Jackson County | 54.7 | Elevated | Income & Poverty |
| 53 | 1,248 | Lee County | 54.5 | Elevated | Community Vulnerability |
| 54 | 1,263 | Montgomery County | 54.3 | Elevated | Community Vulnerability |
| 55 | 1,265 | Rowan County | 54.2 | Elevated | Housing Cost Burden |
| 56 | 1,271 | Guilford County | 54.2 | Elevated | Housing Cost Burden |
| 57 | 1,274 | Madison County | 54.1 | Elevated | Community Vulnerability |
| 58 | 1,288 | Avery County | 54.0 | Elevated | Community Vulnerability |
| 59 | 1,303 | McDowell County | 53.8 | Elevated | Community Vulnerability |
| 60 | 1,317 | Franklin County | 53.7 | Elevated | Housing Cost Burden |
| 61 | 1,376 | Forsyth County | 53.0 | Elevated | Housing Cost Burden |
| 62 | 1,381 | Macon County | 52.9 | Elevated | Community Vulnerability |
| 63 | 1,419 | Harnett County | 52.5 | Elevated | Debt & Delinquency |
| 64 | 1,434 | Yadkin County | 52.3 | Elevated | Community Vulnerability |
| 65 | 1,470 | Surry County | 51.7 | Elevated | Community Vulnerability |
| 66 | 1,479 | Alamance County | 51.5 | Elevated | Housing Cost Burden |
| 67 | 1,500 | Buncombe County | 51.1 | Elevated | Housing Cost Burden |
| 68 | 1,501 | Stokes County | 51.1 | Elevated | Employment & Wages |
| 69 | 1,525 | Transylvania County | 50.8 | Elevated | Housing Cost Burden |
| 70 | 1,550 | Haywood County | 50.5 | Elevated | Community Vulnerability |
| 71 | 1,566 | Ashe County | 50.4 | Elevated | Community Vulnerability |
| 72 | 1,623 | Yancey County | 49.6 | Normal | Community Vulnerability |
| 73 | 1,643 | Watauga County | 49.3 | Normal | Housing Cost Burden |
| 74 | 1,656 | Granville County | 49.3 | Normal | Debt & Delinquency |
| 75 | 1,665 | Polk County | 49.1 | Normal | Community Vulnerability |
| 76 | 1,672 | Davidson County | 49.0 | Normal | Debt & Delinquency |
| 77 | 1,680 | Mitchell County | 48.9 | Normal | Community Vulnerability |
| 78 | 1,732 | New Hanover County | 48.2 | Normal | Housing Cost Burden |
| 79 | 1,735 | Alexander County | 48.2 | Normal | Community Vulnerability |
| 80 | 1,858 | Henderson County | 46.6 | Normal | Housing Cost Burden |
| 81 | 1,868 | Johnston County | 46.4 | Normal | Housing Cost Burden |
| 82 | 1,876 | Carteret County | 46.3 | Normal | Community Vulnerability |
| 83 | 1,895 | Brunswick County | 46.0 | Normal | Housing Cost Burden |
| 84 | 1,988 | Catawba County | 45.0 | Normal | Debt & Delinquency |
| 85 | 2,041 | Pender County | 44.4 | Normal | Housing Cost Burden |
| 86 | 2,046 | Stanly County | 44.3 | Normal | Community Vulnerability |
| 87 | 2,076 | Mecklenburg County | 44.0 | Normal | Housing Cost Burden |
| 88 | 2,152 | Durham County | 42.9 | Normal | Housing Cost Burden |
| 89 | 2,260 | Cabarrus County | 41.4 | Normal | Housing Cost Burden |
| 90 | 2,340 | Davie County | 40.1 | Normal | Community Vulnerability |
| 91 | 2,390 | Dare County | 39.3 | Normal | Housing Cost Burden |
| 92 | 2,465 | Moore County | 38.2 | Normal | Housing Cost Burden |
| 93 | 2,540 | Lincoln County | 36.9 | Normal | Community Vulnerability |
| 94 | 2,605 | Iredell County | 35.8 | Normal | Housing Cost Burden |
| 95 | 2,689 | Orange County | 34.1 | Healthy | Housing Cost Burden |
| 96 | 2,722 | Wake County | 33.6 | Healthy | Housing Cost Burden |
| 97 | 2,767 | Chatham County | 32.8 | Healthy | Housing Cost Burden |
| 98 | 2,775 | Currituck County | 32.6 | Healthy | Employment & Wages |
| 99 | 2,803 | Union County | 31.9 | Healthy | Housing Cost Burden |
| 100 | 2,913 | Camden County | 29.2 | Healthy | Employment & Wages |
7 of 100 county reports for North Carolina are currently available. All 100 counties are scored and visible on the map above. New county reports are published weekly.
How County Scores Work
Each county is scored 0–100 using percentile-rank averaging across five data domains: Debt & Delinquency, Income & Poverty, Housing Cost Burden, Employment & Wages, and Community Vulnerability. A score of 50 means the county falls at the national median. Higher scores indicate greater financial distress.