The Long Haul
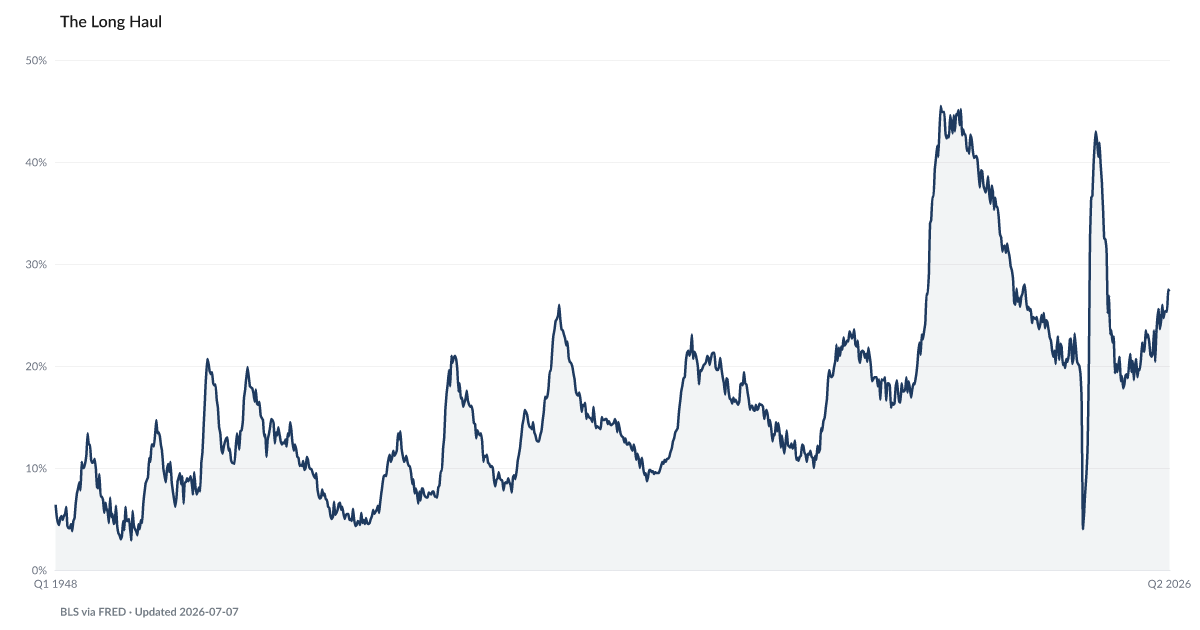
Long-term unemployed as a share of the unemployed
What is the current Long Haul reading?
Long-Term Unemployed Share (27+ Weeks): 25.5% as of 2026-07, and falling. Source: U.S. Bureau of Labor Statistics data retrieved via FRED (LNS13025703).
The Long Haul at 25.5%
Tracking the latest reading relative to recent baseline.
How has The Long Haul changed over time?

Most affected counties
Counties with the highest labor scores in the County Distress Index.
Explore all 3,144 counties →| Period | Value | YoY Change |
|---|---|---|
| Jul 2026 | 25.5% | +0.6 pp |
| Jun 2026 | 27.3% | +4 pp |
| May 2026 | 27.5% | +7.1 pp |
| Apr 2026 | 25.3% | +1.8 pp |
| Mar 2026 | 25.4% | +4.1 pp |
| Feb 2026 | 25.3% | +4.4 pp |
| Jan 2026 | 24.7% | +3.6 pp |
| Dec 2025 | 26% | +3.7 pp |
| Nov 2025 | 24.4% | +1.3 pp |
| Sep 2025 | 23.6% | +0.1 pp |
| Aug 2025 | 25.6% | +4.2 pp |
| Jul 2025 | 24.9% | +3.4 pp |
Frequently Asked Questions
What is Long-Term Unemployed Share (27+ Weeks)?
Long-term unemployed as a share of the unemployed
Why does Long-Term Unemployed Share (27+ Weeks) matter for financial distress?
Long-Term Unemployed Share (27+ Weeks) is one of the indicators tracked by the American Distress Index (ADI), which measures five dimensions of U.S. household financial distress: Delinquency, Default & Legal, Debt Burden, Labor, and Safety Net & Buffer. Changes in this indicator contribute to the overall distress picture.
Where does the Long-Term Unemployed Share (27+ Weeks) data come from?
This data comes from U.S. Bureau of Labor Statistics data retrieved via FRED (LNS13025703). More information: https://fred.stlouisfed.org/series/LNS13025703. The American Distress Index updates this indicator monthly.

Quick poll
Is this affecting you or your household?
Discussion
Get the numbers when they move.
New data drops, indicator updates, and ADI score changes — delivered when it matters. No spam.
or Create an Account for full access
Loading comments…