Tennessee County Distress Index
Financial distress scores for all 95 counties in Tennessee, scored 0–100 across five domains. Mean score: 57.7. 21counties are in Serious Stress or Crisis.
Data: Census, BLS, Urban Institute, HUD, US Courts | Scores as of 2026-03-17
Tennessee Snapshot
Tennessee County Map
Loading interactive map…
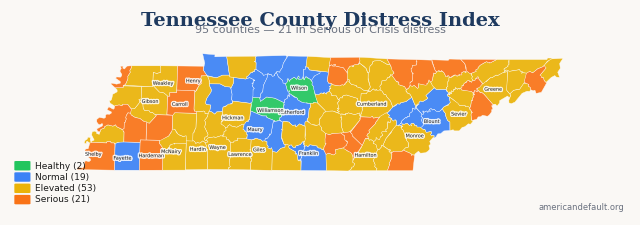
All 95 Tennessee counties colored by distress zone. Hover for details; click released counties for full reports.
Most & Least Distressed
Most Distressed
Least Distressed
Score Distribution
How Tennessee's 95 county scores are distributed across the 0–100 scale.
All Tennessee Counties
95 counties ranked by distress score. Click column headers to sort.
| State Rank | Nat'l Rank | County | Score | Zone | Primary Driver |
|---|---|---|---|---|---|
| 1 | 16 | Hancock County | 78.1 | Serious Stress | Income & Poverty |
| 2 | 40 | Lauderdale County | 76.4 | Serious Stress | Debt & Delinquency |
| 3 | 54 | Cocke County | 75.6 | Serious Stress | Income & Poverty |
| 4 | 82 | Lake County | 74.2 | Serious Stress | Income & Poverty |
| 5 | 138 | Sequatchie County | 71.7 | Serious Stress | Community Vulnerability |
| 6 | 142 | Grundy County | 71.6 | Serious Stress | Income & Poverty |
| 7 | 150 | Carter County | 71.4 | Serious Stress | Community Vulnerability |
| 8 | 168 | Campbell County | 70.9 | Serious Stress | Income & Poverty |
| 9 | 215 | Haywood County | 69.8 | Serious Stress | Income & Poverty |
| 10 | 251 | Scott County | 69.2 | Serious Stress | Income & Poverty |
| 11 | 333 | Carroll County | 67.6 | Serious Stress | Debt & Delinquency |
| 12 | 339 | Hamblen County | 67.5 | Serious Stress | Community Vulnerability |
| 13 | 365 | Madison County | 67.2 | Serious Stress | Debt & Delinquency |
| 14 | 388 | Henry County | 66.8 | Serious Stress | Community Vulnerability |
| 15 | 397 | Hardeman County | 66.7 | Serious Stress | Income & Poverty |
| 16 | 416 | Bledsoe County | 66.4 | Serious Stress | Community Vulnerability |
| 17 | 420 | Polk County | 66.3 | Serious Stress | Community Vulnerability |
| 18 | 449 | Clay County | 65.8 | Serious Stress | Income & Poverty |
| 19 | 467 | Claiborne County | 65.6 | Serious Stress | Community Vulnerability |
| 20 | 473 | Shelby County | 65.5 | Serious Stress | Debt & Delinquency |
| 21 | 489 | Jackson County | 65.1 | Serious Stress | Income & Poverty |
| 22 | 509 | Hardin County | 64.8 | Elevated | Income & Poverty |
| 23 | 532 | Marion County | 64.5 | Elevated | Debt & Delinquency |
| 24 | 540 | Unicoi County | 64.4 | Elevated | Community Vulnerability |
| 25 | 546 | Perry County | 64.2 | Elevated | Community Vulnerability |
| 26 | 562 | Wayne County | 64.0 | Elevated | Community Vulnerability |
| 27 | 609 | Weakley County | 63.2 | Elevated | Debt & Delinquency |
| 28 | 610 | Johnson County | 63.2 | Elevated | Income & Poverty |
| 29 | 630 | Fentress County | 62.8 | Elevated | Income & Poverty |
| 30 | 634 | Monroe County | 62.7 | Elevated | Community Vulnerability |
| 31 | 665 | Morgan County | 62.4 | Elevated | Community Vulnerability |
| 32 | 667 | Warren County | 62.4 | Elevated | Income & Poverty |
| 33 | 675 | Hawkins County | 62.2 | Elevated | Community Vulnerability |
| 34 | 684 | Bradley County | 62.0 | Elevated | Debt & Delinquency |
| 35 | 709 | Union County | 61.6 | Elevated | Employment & Wages |
| 36 | 735 | Meigs County | 61.3 | Elevated | Community Vulnerability |
| 37 | 748 | Lawrence County | 61.1 | Elevated | Community Vulnerability |
| 38 | 751 | Lewis County | 61.0 | Elevated | Community Vulnerability |
| 39 | 753 | Crockett County | 61.0 | Elevated | Debt & Delinquency |
| 40 | 786 | Gibson County | 60.6 | Elevated | Debt & Delinquency |
| 41 | 815 | McMinn County | 60.3 | Elevated | Community Vulnerability |
| 42 | 827 | Rhea County | 60.0 | Elevated | Community Vulnerability |
| 43 | 832 | Pickett County | 60.0 | Elevated | Income & Poverty |
| 44 | 838 | DeKalb County | 59.9 | Elevated | Community Vulnerability |
| 45 | 859 | Tipton County | 59.7 | Elevated | Debt & Delinquency |
| 46 | 864 | Cannon County | 59.6 | Elevated | Community Vulnerability |
| 47 | 915 | Dyer County | 58.8 | Elevated | Debt & Delinquency |
| 48 | 917 | Benton County | 58.8 | Elevated | Income & Poverty |
| 49 | 928 | Greene County | 58.6 | Elevated | Community Vulnerability |
| 50 | 940 | Obion County | 58.5 | Elevated | Income & Poverty |
| 51 | 944 | Houston County | 58.4 | Elevated | Community Vulnerability |
| 52 | 971 | Decatur County | 58.2 | Elevated | Income & Poverty |
| 53 | 986 | Henderson County | 58.1 | Elevated | Debt & Delinquency |
| 54 | 1,007 | White County | 57.8 | Elevated | Community Vulnerability |
| 55 | 1,054 | Anderson County | 57.3 | Elevated | Debt & Delinquency |
| 56 | 1,072 | Hickman County | 57.2 | Elevated | Community Vulnerability |
| 57 | 1,114 | Cumberland County | 56.5 | Elevated | Community Vulnerability |
| 58 | 1,121 | Macon County | 56.3 | Elevated | Income & Poverty |
| 59 | 1,131 | Bedford County | 56.2 | Elevated | Debt & Delinquency |
| 60 | 1,139 | Van Buren County | 56.1 | Elevated | Community Vulnerability |
| 61 | 1,172 | Giles County | 55.6 | Elevated | Debt & Delinquency |
| 62 | 1,174 | Putnam County | 55.6 | Elevated | Housing Cost Burden |
| 63 | 1,181 | Sullivan County | 55.4 | Elevated | Debt & Delinquency |
| 64 | 1,185 | Washington County | 55.3 | Elevated | Housing Cost Burden |
| 65 | 1,218 | McNairy County | 54.8 | Elevated | Income & Poverty |
| 66 | 1,225 | Grainger County | 54.8 | Elevated | Community Vulnerability |
| 67 | 1,270 | Montgomery County | 54.2 | Elevated | Housing Cost Burden |
| 68 | 1,287 | Coffee County | 54.0 | Elevated | Debt & Delinquency |
| 69 | 1,309 | Jefferson County | 53.8 | Elevated | Community Vulnerability |
| 70 | 1,386 | Sevier County | 52.8 | Elevated | Community Vulnerability |
| 71 | 1,397 | Chester County | 52.7 | Elevated | Employment & Wages |
| 72 | 1,446 | Overton County | 52.1 | Elevated | Debt & Delinquency |
| 73 | 1,450 | Lincoln County | 52.1 | Elevated | Debt & Delinquency |
| 74 | 1,467 | Hamilton County | 51.7 | Elevated | Debt & Delinquency |
| 75 | 1,610 | Franklin County | 49.8 | Normal | Community Vulnerability |
| 76 | 1,690 | Davidson County | 48.8 | Normal | Housing Cost Burden |
| 77 | 1,709 | Roane County | 48.5 | Normal | Debt & Delinquency |
| 78 | 1,719 | Trousdale County | 48.4 | Normal | Employment & Wages |
| 79 | 1,730 | Maury County | 48.2 | Normal | Housing Cost Burden |
| 80 | 1,733 | Humphreys County | 48.2 | Normal | Community Vulnerability |
| 81 | 1,827 | Robertson County | 47.0 | Normal | Housing Cost Burden |
| 82 | 1,835 | Fayette County | 46.9 | Normal | Debt & Delinquency |
| 83 | 1,863 | Knox County | 46.5 | Normal | Housing Cost Burden |
| 84 | 1,962 | Rutherford County | 45.3 | Normal | Housing Cost Burden |
| 85 | 1,966 | Smith County | 45.2 | Normal | Debt & Delinquency |
| 86 | 1,989 | Dickson County | 45.0 | Normal | Community Vulnerability |
| 87 | 2,017 | Stewart County | 44.7 | Normal | Community Vulnerability |
| 88 | 2,032 | Blount County | 44.6 | Normal | Employment & Wages |
| 89 | 2,178 | Loudon County | 42.5 | Normal | Employment & Wages |
| 90 | 2,237 | Marshall County | 41.6 | Normal | Debt & Delinquency |
| 91 | 2,272 | Sumner County | 41.3 | Normal | Housing Cost Burden |
| 92 | 2,323 | Cheatham County | 40.4 | Normal | Community Vulnerability |
| 93 | 2,487 | Moore County | 37.9 | Normal | Debt & Delinquency |
| 94 | 2,695 | Wilson County | 34.1 | Healthy | Housing Cost Burden |
| 95 | 3,139 | Williamson County | 15.9 | Healthy | Housing Cost Burden |
2 of 95 county reports for Tennessee are currently available. All 95 counties are scored and visible on the map above. New county reports are published weekly.
How County Scores Work
Each county is scored 0–100 using percentile-rank averaging across five data domains: Debt & Delinquency, Income & Poverty, Housing Cost Burden, Employment & Wages, and Community Vulnerability. A score of 50 means the county falls at the national median. Higher scores indicate greater financial distress.