Pennsylvania County Distress Index
Financial distress scores for all 67 counties in Pennsylvania, scored 0–100 across five domains. Mean score: 46.5. 2counties are in Serious Stress or Crisis.
Data: Census, BLS, Urban Institute, HUD, US Courts | Scores as of 2026-03-17
Pennsylvania Snapshot
Pennsylvania County Map
Loading interactive map…
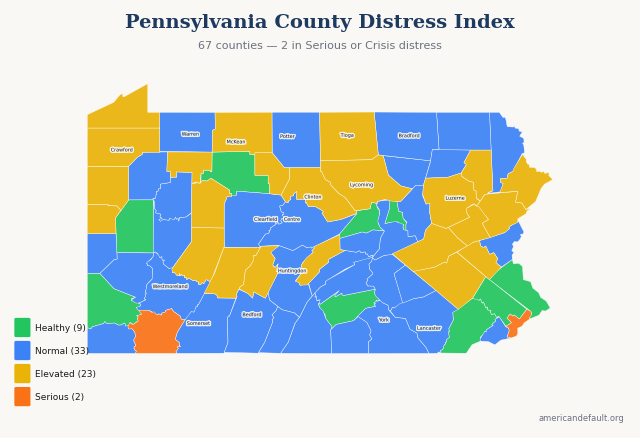
All 67 Pennsylvania counties colored by distress zone. Hover for details; click released counties for full reports.
Most & Least Distressed
Most Distressed
Least Distressed
Score Distribution
How Pennsylvania's 67 county scores are distributed across the 0–100 scale.
All Pennsylvania Counties
67 counties ranked by distress score. Click column headers to sort.
| State Rank | Nat'l Rank | County | Score | Zone | Primary Driver |
|---|---|---|---|---|---|
| 1 | 396 | Philadelphia County | 66.7 | Serious Stress | Housing Cost Burden |
| 2 | 427 | Fayette County | 66.2 | Serious Stress | Income & Poverty |
| 3 | 765 | Luzerne County | 60.9 | Elevated | Housing Cost Burden |
| 4 | 927 | Cameron County | 58.6 | Elevated | Income & Poverty |
| 5 | 954 | Clinton County | 58.4 | Elevated | Income & Poverty |
| 6 | 968 | Lackawanna County | 58.3 | Elevated | Housing Cost Burden |
| 7 | 1,159 | Lycoming County | 55.8 | Elevated | Housing Cost Burden |
| 8 | 1,202 | Jefferson County | 55.1 | Elevated | Income & Poverty |
| 9 | 1,241 | Carbon County | 54.6 | Elevated | Employment & Wages |
| 10 | 1,249 | Forest County | 54.5 | Elevated | Income & Poverty |
| 11 | 1,291 | Blair County | 54.0 | Elevated | Employment & Wages |
| 12 | 1,304 | Mifflin County | 53.8 | Elevated | Income & Poverty |
| 13 | 1,311 | Berks County | 53.7 | Elevated | Housing Cost Burden |
| 14 | 1,325 | Indiana County | 53.6 | Elevated | Income & Poverty |
| 15 | 1,354 | Monroe County | 53.3 | Elevated | Housing Cost Burden |
| 16 | 1,393 | Schuylkill County | 52.7 | Elevated | Employment & Wages |
| 17 | 1,432 | Lehigh County | 52.3 | Elevated | Housing Cost Burden |
| 18 | 1,436 | Lawrence County | 52.3 | Elevated | Employment & Wages |
| 19 | 1,442 | Cambria County | 52.2 | Elevated | Employment & Wages |
| 20 | 1,445 | Pike County | 52.2 | Elevated | Housing Cost Burden |
| 21 | 1,449 | Erie County | 52.1 | Elevated | Housing Cost Burden |
| 22 | 1,459 | Crawford County | 51.8 | Elevated | Employment & Wages |
| 23 | 1,496 | McKean County | 51.2 | Elevated | Income & Poverty |
| 24 | 1,538 | Tioga County | 50.7 | Elevated | Employment & Wages |
| 25 | 1,593 | Mercer County | 50.1 | Elevated | Employment & Wages |
| 26 | 1,599 | Clearfield County | 50.0 | Normal | Income & Poverty |
| 27 | 1,644 | Venango County | 49.3 | Normal | Employment & Wages |
| 28 | 1,650 | Dauphin County | 49.3 | Normal | Housing Cost Burden |
| 29 | 1,676 | Clarion County | 49.0 | Normal | Employment & Wages |
| 30 | 1,721 | Perry County | 48.3 | Normal | Employment & Wages |
| 31 | 1,746 | Greene County | 48.0 | Normal | Debt & Delinquency |
| 32 | 1,823 | Lebanon County | 47.1 | Normal | Housing Cost Burden |
| 33 | 1,849 | Bedford County | 46.7 | Normal | Employment & Wages |
| 34 | 1,872 | Potter County | 46.3 | Normal | Employment & Wages |
| 35 | 1,879 | Columbia County | 46.3 | Normal | Employment & Wages |
| 36 | 1,898 | Huntingdon County | 46.0 | Normal | Employment & Wages |
| 37 | 1,907 | Northumberland County | 45.9 | Normal | Employment & Wages |
| 38 | 1,910 | Juniata County | 45.9 | Normal | Employment & Wages |
| 39 | 1,925 | Wayne County | 45.6 | Normal | Employment & Wages |
| 40 | 1,953 | Franklin County | 45.3 | Normal | Employment & Wages |
| 41 | 1,978 | Snyder County | 45.1 | Normal | Employment & Wages |
| 42 | 2,023 | Delaware County | 44.6 | Normal | Housing Cost Burden |
| 43 | 2,037 | Northampton County | 44.5 | Normal | Housing Cost Burden |
| 44 | 2,062 | Beaver County | 44.2 | Normal | Employment & Wages |
| 45 | 2,112 | Somerset County | 43.6 | Normal | Employment & Wages |
| 46 | 2,117 | Susquehanna County | 43.5 | Normal | Employment & Wages |
| 47 | 2,141 | Bradford County | 43.1 | Normal | Income & Poverty |
| 48 | 2,142 | Armstrong County | 43.1 | Normal | Employment & Wages |
| 49 | 2,143 | Sullivan County | 43.1 | Normal | Employment & Wages |
| 50 | 2,161 | Centre County | 42.7 | Normal | Housing Cost Burden |
| 51 | 2,176 | Lancaster County | 42.5 | Normal | Housing Cost Burden |
| 52 | 2,304 | Wyoming County | 40.8 | Normal | Employment & Wages |
| 53 | 2,324 | Warren County | 40.4 | Normal | Employment & Wages |
| 54 | 2,346 | Fulton County | 40.0 | Normal | Income & Poverty |
| 55 | 2,395 | Westmoreland County | 39.3 | Normal | Employment & Wages |
| 56 | 2,425 | Adams County | 38.7 | Normal | Employment & Wages |
| 57 | 2,449 | York County | 38.4 | Normal | Housing Cost Burden |
| 58 | 2,647 | Allegheny County | 35.2 | Normal | Housing Cost Burden |
| 59 | 2,654 | Cumberland County | 34.9 | Healthy | Housing Cost Burden |
| 60 | 2,667 | Union County | 34.7 | Healthy | Housing Cost Burden |
| 61 | 2,742 | Elk County | 33.3 | Healthy | Employment & Wages |
| 62 | 2,753 | Washington County | 33.1 | Healthy | Housing Cost Burden |
| 63 | 2,840 | Montour County | 31.4 | Healthy | Housing Cost Burden |
| 64 | 2,895 | Bucks County | 29.8 | Healthy | Housing Cost Burden |
| 65 | 2,906 | Butler County | 29.4 | Healthy | Employment & Wages |
| 66 | 2,989 | Montgomery County | 26.9 | Healthy | Housing Cost Burden |
| 67 | 3,060 | Chester County | 23.8 | Healthy | Housing Cost Burden |
2 of 67 county reports for Pennsylvania are currently available. All 67 counties are scored and visible on the map above. New county reports are published weekly.
How County Scores Work
Each county is scored 0–100 using percentile-rank averaging across five data domains: Debt & Delinquency, Income & Poverty, Housing Cost Burden, Employment & Wages, and Community Vulnerability. A score of 50 means the county falls at the national median. Higher scores indicate greater financial distress.