Oklahoma County Distress Index
Financial distress scores for all 77 counties in Oklahoma, scored 0–100 across five domains. Mean score: 60.4. 32counties are in Serious Stress or Crisis.
Data: Census, BLS, Urban Institute, HUD, US Courts | Scores as of 2026-03-17
Oklahoma Snapshot
Oklahoma County Map
Loading interactive map…
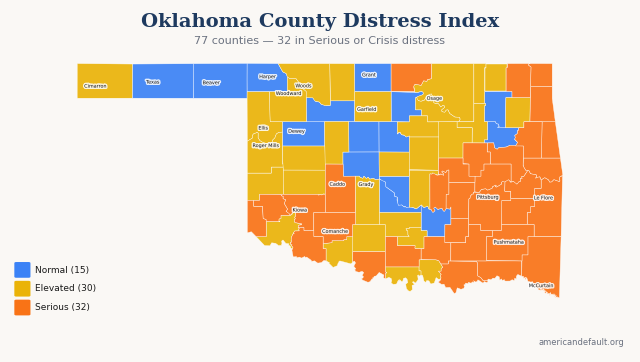
All 77 Oklahoma counties colored by distress zone. Hover for details; click released counties for full reports.
Most & Least Distressed
Most Distressed
Least Distressed
Score Distribution
How Oklahoma's 77 county scores are distributed across the 0–100 scale.
All Oklahoma Counties
77 counties ranked by distress score. Click column headers to sort.
| State Rank | Nat'l Rank | County | Score | Zone | Primary Driver |
|---|---|---|---|---|---|
| 1 | 8 | Sequoyah County | 79.2 | Serious Stress | Community Vulnerability |
| 2 | 27 | Adair County | 77.2 | Serious Stress | Community Vulnerability |
| 3 | 33 | McIntosh County | 76.8 | Serious Stress | Community Vulnerability |
| 4 | 34 | Seminole County | 76.8 | Serious Stress | Community Vulnerability |
| 5 | 74 | Choctaw County | 74.6 | Serious Stress | Community Vulnerability |
| 6 | 75 | Okfuskee County | 74.5 | Serious Stress | Income & Poverty |
| 7 | 77 | Muskogee County | 74.4 | Serious Stress | Community Vulnerability |
| 8 | 101 | Tillman County | 73.2 | Serious Stress | Community Vulnerability |
| 9 | 113 | Le Flore County | 72.5 | Serious Stress | Community Vulnerability |
| 10 | 118 | Pushmataha County | 72.4 | Serious Stress | Community Vulnerability |
| 11 | 127 | Delaware County | 72.1 | Serious Stress | Community Vulnerability |
| 12 | 135 | Okmulgee County | 71.9 | Serious Stress | Community Vulnerability |
| 13 | 153 | Ottawa County | 71.2 | Serious Stress | Community Vulnerability |
| 14 | 165 | Latimer County | 70.9 | Serious Stress | Income & Poverty |
| 15 | 174 | Comanche County | 70.7 | Serious Stress | Community Vulnerability |
| 16 | 175 | Jefferson County | 70.7 | Serious Stress | Income & Poverty |
| 17 | 184 | Atoka County | 70.6 | Serious Stress | Community Vulnerability |
| 18 | 203 | Harmon County | 70.2 | Serious Stress | Income & Poverty |
| 19 | 227 | Pittsburg County | 69.7 | Serious Stress | Community Vulnerability |
| 20 | 230 | McCurtain County | 69.6 | Serious Stress | Community Vulnerability |
| 21 | 248 | Bryan County | 69.2 | Serious Stress | Community Vulnerability |
| 22 | 254 | Hughes County | 69.1 | Serious Stress | Community Vulnerability |
| 23 | 306 | Caddo County | 68.1 | Serious Stress | Debt & Delinquency |
| 24 | 311 | Cherokee County | 68.0 | Serious Stress | Community Vulnerability |
| 25 | 321 | Johnston County | 67.8 | Serious Stress | Community Vulnerability |
| 26 | 377 | Kiowa County | 67.0 | Serious Stress | Income & Poverty |
| 27 | 379 | Haskell County | 67.0 | Serious Stress | Community Vulnerability |
| 28 | 395 | Carter County | 66.7 | Serious Stress | Community Vulnerability |
| 29 | 413 | Coal County | 66.4 | Serious Stress | Community Vulnerability |
| 30 | 419 | Greer County | 66.3 | Serious Stress | Income & Poverty |
| 31 | 446 | Craig County | 65.9 | Serious Stress | Community Vulnerability |
| 32 | 490 | Kay County | 65.1 | Serious Stress | Debt & Delinquency |
| 33 | 511 | Pottawatomie County | 64.8 | Elevated | Debt & Delinquency |
| 34 | 539 | Cotton County | 64.4 | Elevated | Debt & Delinquency |
| 35 | 686 | Beckham County | 62.0 | Elevated | Income & Poverty |
| 36 | 694 | Nowata County | 61.9 | Elevated | Community Vulnerability |
| 37 | 696 | Pawnee County | 61.9 | Elevated | Community Vulnerability |
| 38 | 797 | Osage County | 60.5 | Elevated | Community Vulnerability |
| 39 | 856 | Garfield County | 59.7 | Elevated | Community Vulnerability |
| 40 | 892 | Mayes County | 59.2 | Elevated | Community Vulnerability |
| 41 | 909 | Payne County | 59.0 | Elevated | Housing Cost Burden |
| 42 | 924 | Washita County | 58.7 | Elevated | Community Vulnerability |
| 43 | 930 | Love County | 58.6 | Elevated | Community Vulnerability |
| 44 | 960 | Lincoln County | 58.4 | Elevated | Community Vulnerability |
| 45 | 987 | Garvin County | 58.1 | Elevated | Debt & Delinquency |
| 46 | 1,027 | Ellis County | 57.6 | Elevated | Community Vulnerability |
| 47 | 1,045 | Stephens County | 57.5 | Elevated | Community Vulnerability |
| 48 | 1,092 | Oklahoma County | 56.7 | Elevated | Housing Cost Burden |
| 49 | 1,102 | Marshall County | 56.5 | Elevated | Community Vulnerability |
| 50 | 1,123 | Cimarron County | 56.3 | Elevated | Community Vulnerability |
| 51 | 1,190 | Blaine County | 55.2 | Elevated | Debt & Delinquency |
| 52 | 1,192 | Custer County | 55.2 | Elevated | Housing Cost Burden |
| 53 | 1,207 | Creek County | 55.1 | Elevated | Debt & Delinquency |
| 54 | 1,208 | Jackson County | 55.1 | Elevated | Community Vulnerability |
| 55 | 1,217 | Tulsa County | 54.9 | Elevated | Housing Cost Burden |
| 56 | 1,282 | Murray County | 54.1 | Elevated | Community Vulnerability |
| 57 | 1,329 | Woods County | 53.6 | Elevated | Housing Cost Burden |
| 58 | 1,357 | Washington County | 53.2 | Elevated | Community Vulnerability |
| 59 | 1,409 | Alfalfa County | 52.6 | Elevated | Community Vulnerability |
| 60 | 1,429 | Roger Mills County | 52.3 | Elevated | Community Vulnerability |
| 61 | 1,480 | Woodward County | 51.5 | Elevated | Community Vulnerability |
| 62 | 1,526 | Grady County | 50.8 | Elevated | Community Vulnerability |
| 63 | 1,740 | Cleveland County | 48.1 | Normal | Housing Cost Burden |
| 64 | 1,811 | Dewey County | 47.2 | Normal | Community Vulnerability |
| 65 | 1,839 | Logan County | 46.9 | Normal | Community Vulnerability |
| 66 | 1,843 | Pontotoc County | 46.8 | Normal | Community Vulnerability |
| 67 | 1,880 | Grant County | 46.3 | Normal | Community Vulnerability |
| 68 | 1,909 | Noble County | 45.9 | Normal | Debt & Delinquency |
| 69 | 1,969 | Wagoner County | 45.2 | Normal | Community Vulnerability |
| 70 | 2,043 | McClain County | 44.4 | Normal | Debt & Delinquency |
| 71 | 2,050 | Texas County | 44.3 | Normal | Employment & Wages |
| 72 | 2,073 | Rogers County | 44.0 | Normal | Community Vulnerability |
| 73 | 2,148 | Canadian County | 42.9 | Normal | Debt & Delinquency |
| 74 | 2,192 | Major County | 42.3 | Normal | Community Vulnerability |
| 75 | 2,218 | Harper County | 41.9 | Normal | Community Vulnerability |
| 76 | 2,239 | Beaver County | 41.6 | Normal | Community Vulnerability |
| 77 | 2,446 | Kingfisher County | 38.5 | Normal | Debt & Delinquency |
4 of 77 county reports for Oklahoma are currently available. All 77 counties are scored and visible on the map above. New county reports are published weekly.
How County Scores Work
Each county is scored 0–100 using percentile-rank averaging across five data domains: Debt & Delinquency, Income & Poverty, Housing Cost Burden, Employment & Wages, and Community Vulnerability. A score of 50 means the county falls at the national median. Higher scores indicate greater financial distress.