Washington County Distress Index
Financial distress scores for all 39 counties in Washington, scored 0–100 across five domains. Mean score: 48.4.
Data: Census, BLS, Urban Institute, HUD, US Courts | Scores as of 2026-03-17
Washington Snapshot
Washington County Map
Loading interactive map…
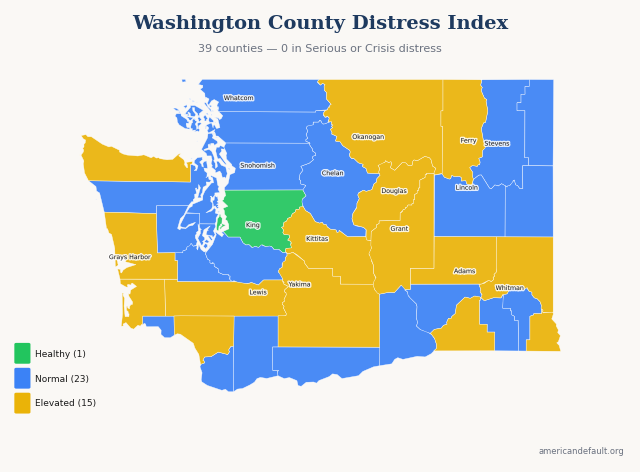
All 39 Washington counties colored by distress zone. Hover for details; click released counties for full reports.
Most & Least Distressed
Most Distressed
Least Distressed
Score Distribution
How Washington's 39 county scores are distributed across the 0–100 scale.
All Washington Counties
39 counties ranked by distress score. Click column headers to sort.
| State Rank | Nat'l Rank | County | Score | Zone | Primary Driver |
|---|---|---|---|---|---|
| 1 | 531 | Yakima County | 64.5 | Elevated | Employment & Wages |
| 2 | 783 | Adams County | 60.7 | Elevated | Employment & Wages |
| 3 | 844 | Okanogan County | 59.8 | Elevated | Income & Poverty |
| 4 | 876 | Grays Harbor County | 59.4 | Elevated | Employment & Wages |
| 5 | 887 | Asotin County | 59.3 | Elevated | Housing Cost Burden |
| 6 | 1,090 | Lewis County | 56.8 | Elevated | Housing Cost Burden |
| 7 | 1,175 | Grant County | 55.5 | Elevated | Employment & Wages |
| 8 | 1,221 | Walla Walla County | 54.8 | Elevated | Housing Cost Burden |
| 9 | 1,245 | Cowlitz County | 54.5 | Elevated | Housing Cost Burden |
| 10 | 1,266 | Douglas County | 54.2 | Elevated | Employment & Wages |
| 11 | 1,364 | Clallam County | 53.1 | Elevated | Housing Cost Burden |
| 12 | 1,421 | Pacific County | 52.4 | Elevated | Employment & Wages |
| 13 | 1,468 | Whitman County | 51.7 | Elevated | Housing Cost Burden |
| 14 | 1,477 | Ferry County | 51.5 | Elevated | Income & Poverty |
| 15 | 1,540 | Kittitas County | 50.7 | Elevated | Housing Cost Burden |
| 16 | 1,608 | Franklin County | 49.8 | Normal | Employment & Wages |
| 17 | 1,625 | Mason County | 49.5 | Normal | Employment & Wages |
| 18 | 1,741 | Pend Oreille County | 48.1 | Normal | Income & Poverty |
| 19 | 1,762 | Chelan County | 47.8 | Normal | Community Vulnerability |
| 20 | 1,802 | Whatcom County | 47.4 | Normal | Housing Cost Burden |
| 21 | 1,807 | Spokane County | 47.3 | Normal | Housing Cost Burden |
| 22 | 1,819 | Pierce County | 47.1 | Normal | Housing Cost Burden |
| 23 | 1,864 | Klickitat County | 46.5 | Normal | Housing Cost Burden |
| 24 | 1,914 | Thurston County | 45.8 | Normal | Housing Cost Burden |
| 25 | 1,955 | Benton County | 45.3 | Normal | Housing Cost Burden |
| 26 | 1,972 | Garfield County | 45.1 | Normal | Income & Poverty |
| 27 | 2,026 | Skagit County | 44.6 | Normal | Housing Cost Burden |
| 28 | 2,030 | Stevens County | 44.6 | Normal | Employment & Wages |
| 29 | 2,035 | Columbia County | 44.5 | Normal | Community Vulnerability |
| 30 | 2,039 | Wahkiakum County | 44.4 | Normal | Employment & Wages |
| 31 | 2,216 | Kitsap County | 41.9 | Normal | Housing Cost Burden |
| 32 | 2,224 | Snohomish County | 41.8 | Normal | Housing Cost Burden |
| 33 | 2,269 | Clark County | 41.3 | Normal | Housing Cost Burden |
| 34 | 2,293 | Skamania County | 40.9 | Normal | Employment & Wages |
| 35 | 2,347 | Jefferson County | 40.0 | Normal | Employment & Wages |
| 36 | 2,355 | Island County | 39.9 | Normal | Housing Cost Burden |
| 37 | 2,548 | Lincoln County | 36.8 | Normal | Employment & Wages |
| 38 | 2,553 | San Juan County | 36.8 | Normal | Housing Cost Burden |
| 39 | 2,812 | King County | 31.8 | Healthy | Housing Cost Burden |
1 of 39 county reports for Washington are currently available. All 39 counties are scored and visible on the map above. New county reports are published weekly.
How County Scores Work
Each county is scored 0–100 using percentile-rank averaging across five data domains: Debt & Delinquency, Income & Poverty, Housing Cost Burden, Employment & Wages, and Community Vulnerability. A score of 50 means the county falls at the national median. Higher scores indicate greater financial distress.