Virginia County Distress Index
Financial distress scores for all 133 counties in Virginia, scored 0–100 across five domains. Mean score: 48.5. 14counties are in Serious Stress or Crisis.
Data: Census, BLS, Urban Institute, HUD, US Courts | Scores as of 2026-03-17
Virginia Snapshot
Virginia County Map
Loading interactive map…
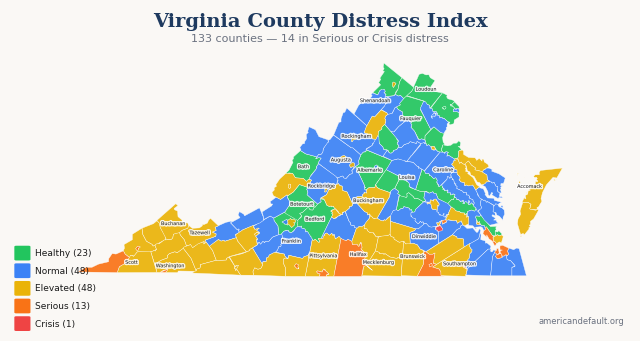
All 133 Virginia counties colored by distress zone. Hover for details; click released counties for full reports.
Most & Least Distressed
Most Distressed
Least Distressed
Score Distribution
How Virginia's 133 county scores are distributed across the 0–100 scale.
All Virginia Counties
133 counties ranked by distress score. Click column headers to sort.
| State Rank | Nat'l Rank | County | Score | Zone | Primary Driver |
|---|---|---|---|---|---|
| 1 | 2 | Petersburg city | 82.0 | Crisis | Housing Cost Burden |
| 2 | 63 | Bristol city | 75.2 | Serious Stress | Income & Poverty |
| 3 | 95 | Hopewell city | 73.4 | Serious Stress | Debt & Delinquency |
| 4 | 100 | Lee County | 73.2 | Serious Stress | Income & Poverty |
| 5 | 108 | Martinsville city | 72.8 | Serious Stress | Income & Poverty |
| 6 | 176 | Portsmouth city | 70.7 | Serious Stress | Housing Cost Burden |
| 7 | 211 | Danville city | 70.0 | Serious Stress | Income & Poverty |
| 8 | 213 | Norton city | 70.0 | Serious Stress | Income & Poverty |
| 9 | 283 | Norfolk city | 68.6 | Serious Stress | Housing Cost Burden |
| 10 | 328 | Emporia city | 67.7 | Serious Stress | Income & Poverty |
| 11 | 422 | Greensville County | 66.3 | Serious Stress | Income & Poverty |
| 12 | 451 | Newport News city | 65.8 | Serious Stress | Housing Cost Burden |
| 13 | 456 | Halifax County | 65.8 | Serious Stress | Income & Poverty |
| 14 | 476 | Franklin city | 65.4 | Serious Stress | Income & Poverty |
| 15 | 506 | Henry County | 64.9 | Elevated | Income & Poverty |
| 16 | 526 | Prince Edward County | 64.6 | Elevated | Income & Poverty |
| 17 | 541 | Hampton city | 64.3 | Elevated | Housing Cost Burden |
| 18 | 542 | Sussex County | 64.3 | Elevated | Income & Poverty |
| 19 | 583 | Tazewell County | 63.7 | Elevated | Income & Poverty |
| 20 | 584 | Scott County | 63.6 | Elevated | Income & Poverty |
| 21 | 594 | Wise County | 63.5 | Elevated | Income & Poverty |
| 22 | 611 | Waynesboro city | 63.2 | Elevated | Housing Cost Burden |
| 23 | 615 | Buchanan County | 63.1 | Elevated | Income & Poverty |
| 24 | 616 | Buckingham County | 63.1 | Elevated | Debt & Delinquency |
| 25 | 658 | Richmond city | 62.4 | Elevated | Housing Cost Burden |
| 26 | 659 | Roanoke city | 62.4 | Elevated | Income & Poverty |
| 27 | 670 | Radford city | 62.3 | Elevated | Housing Cost Burden |
| 28 | 677 | Charlotte County | 62.2 | Elevated | Income & Poverty |
| 29 | 681 | Essex County | 62.1 | Elevated | Housing Cost Burden |
| 30 | 688 | Westmoreland County | 62.0 | Elevated | Housing Cost Burden |
| 31 | 710 | Lunenburg County | 61.6 | Elevated | Income & Poverty |
| 32 | 747 | Nottoway County | 61.1 | Elevated | Income & Poverty |
| 33 | 763 | Northampton County | 60.9 | Elevated | Income & Poverty |
| 34 | 835 | Grayson County | 59.9 | Elevated | Income & Poverty |
| 35 | 873 | Carroll County | 59.5 | Elevated | Income & Poverty |
| 36 | 910 | Smyth County | 58.9 | Elevated | Income & Poverty |
| 37 | 936 | Mecklenburg County | 58.5 | Elevated | Income & Poverty |
| 38 | 965 | Dickenson County | 58.3 | Elevated | Income & Poverty |
| 39 | 996 | Winchester city | 57.9 | Elevated | Housing Cost Burden |
| 40 | 1,004 | Lynchburg city | 57.9 | Elevated | Housing Cost Burden |
| 41 | 1,005 | Brunswick County | 57.8 | Elevated | Income & Poverty |
| 42 | 1,013 | Galax city | 57.7 | Elevated | Income & Poverty |
| 43 | 1,017 | Page County | 57.7 | Elevated | Employment & Wages |
| 44 | 1,018 | Colonial Heights city | 57.7 | Elevated | Housing Cost Burden |
| 45 | 1,020 | Pulaski County | 57.7 | Elevated | Income & Poverty |
| 46 | 1,030 | Accomack County | 57.6 | Elevated | Income & Poverty |
| 47 | 1,031 | Russell County | 57.6 | Elevated | Income & Poverty |
| 48 | 1,037 | Buena Vista city | 57.5 | Elevated | Housing Cost Burden |
| 49 | 1,078 | Covington city | 57.1 | Elevated | Income & Poverty |
| 50 | 1,134 | Harrisonburg city | 56.1 | Elevated | Housing Cost Burden |
| 51 | 1,155 | Patrick County | 55.8 | Elevated | Income & Poverty |
| 52 | 1,220 | Staunton city | 54.8 | Elevated | Housing Cost Burden |
| 53 | 1,300 | Richmond County | 53.9 | Elevated | Income & Poverty |
| 54 | 1,380 | Williamsburg city | 52.9 | Elevated | Housing Cost Burden |
| 55 | 1,388 | Washington County | 52.8 | Elevated | Community Vulnerability |
| 56 | 1,406 | Amherst County | 52.6 | Elevated | Debt & Delinquency |
| 57 | 1,416 | Wythe County | 52.5 | Elevated | Debt & Delinquency |
| 58 | 1,430 | Pittsylvania County | 52.3 | Elevated | Income & Poverty |
| 59 | 1,473 | Alleghany County | 51.6 | Elevated | Income & Poverty |
| 60 | 1,497 | Fredericksburg city | 51.2 | Elevated | Housing Cost Burden |
| 61 | 1,516 | Southampton County | 51.0 | Elevated | Debt & Delinquency |
| 62 | 1,539 | Charles City County | 50.7 | Elevated | Debt & Delinquency |
| 63 | 1,602 | Cumberland County | 50.0 | Normal | Income & Poverty |
| 64 | 1,694 | Suffolk city | 48.8 | Normal | Housing Cost Burden |
| 65 | 1,717 | Middlesex County | 48.4 | Normal | Community Vulnerability |
| 66 | 1,808 | Dinwiddie County | 47.3 | Normal | Debt & Delinquency |
| 67 | 1,813 | Amelia County | 47.1 | Normal | Housing Cost Burden |
| 68 | 1,832 | Lancaster County | 46.9 | Normal | Income & Poverty |
| 69 | 1,847 | Manassas city | 46.7 | Normal | Housing Cost Burden |
| 70 | 1,856 | King and Queen County | 46.6 | Normal | Debt & Delinquency |
| 71 | 1,877 | Highland County | 46.3 | Normal | Income & Poverty |
| 72 | 1,954 | Manassas Park city | 45.3 | Normal | Housing Cost Burden |
| 73 | 1,964 | Chesapeake city | 45.2 | Normal | Housing Cost Burden |
| 74 | 2,009 | Northumberland County | 44.8 | Normal | Employment & Wages |
| 75 | 2,016 | Appomattox County | 44.7 | Normal | Employment & Wages |
| 76 | 2,038 | Charlottesville city | 44.4 | Normal | Housing Cost Burden |
| 77 | 2,049 | Lexington city | 44.3 | Normal | Housing Cost Burden |
| 78 | 2,060 | Mathews County | 44.2 | Normal | Employment & Wages |
| 79 | 2,100 | Montgomery County | 43.8 | Normal | Housing Cost Burden |
| 80 | 2,128 | Virginia Beach city | 43.4 | Normal | Housing Cost Burden |
| 81 | 2,173 | Craig County | 42.6 | Normal | Housing Cost Burden |
| 82 | 2,204 | Prince George County | 42.1 | Normal | Housing Cost Burden |
| 83 | 2,207 | Henrico County | 42.1 | Normal | Housing Cost Burden |
| 84 | 2,256 | Salem city | 41.4 | Normal | Housing Cost Burden |
| 85 | 2,279 | Caroline County | 41.1 | Normal | Debt & Delinquency |
| 86 | 2,290 | Gloucester County | 41.0 | Normal | Employment & Wages |
| 87 | 2,305 | Culpeper County | 40.8 | Normal | Housing Cost Burden |
| 88 | 2,307 | Campbell County | 40.8 | Normal | Debt & Delinquency |
| 89 | 2,310 | Nelson County | 40.7 | Normal | Employment & Wages |
| 90 | 2,336 | Louisa County | 40.2 | Normal | Debt & Delinquency |
| 91 | 2,344 | Rockbridge County | 40.1 | Normal | Employment & Wages |
| 92 | 2,351 | Shenandoah County | 40.0 | Normal | Community Vulnerability |
| 93 | 2,374 | Franklin County | 39.6 | Normal | Employment & Wages |
| 94 | 2,399 | Spotsylvania County | 39.2 | Normal | Housing Cost Burden |
| 95 | 2,400 | Greene County | 39.1 | Normal | Housing Cost Burden |
| 96 | 2,418 | Alexandria city | 38.8 | Normal | Housing Cost Burden |
| 97 | 2,420 | Giles County | 38.8 | Normal | Debt & Delinquency |
| 98 | 2,438 | Prince William County | 38.6 | Normal | Housing Cost Burden |
| 99 | 2,471 | Chesterfield County | 38.1 | Normal | Housing Cost Burden |
| 100 | 2,498 | Warren County | 37.8 | Normal | Community Vulnerability |
| 101 | 2,503 | Floyd County | 37.7 | Normal | Employment & Wages |
| 102 | 2,507 | Augusta County | 37.6 | Normal | Employment & Wages |
| 103 | 2,517 | Surry County | 37.3 | Normal | Debt & Delinquency |
| 104 | 2,521 | Orange County | 37.3 | Normal | Employment & Wages |
| 105 | 2,541 | Isle of Wight County | 36.9 | Normal | Housing Cost Burden |
| 106 | 2,563 | Rappahannock County | 36.5 | Normal | Employment & Wages |
| 107 | 2,594 | King William County | 35.9 | Normal | Housing Cost Burden |
| 108 | 2,626 | Bland County | 35.5 | Normal | Income & Poverty |
| 109 | 2,644 | James City County | 35.2 | Normal | Housing Cost Burden |
| 110 | 2,645 | Rockingham County | 35.2 | Normal | Employment & Wages |
| 111 | 2,664 | Fluvanna County | 34.7 | Healthy | Employment & Wages |
| 112 | 2,675 | Bedford County | 34.6 | Healthy | Employment & Wages |
| 113 | 2,713 | York County | 33.8 | Healthy | Housing Cost Burden |
| 114 | 2,740 | Stafford County | 33.3 | Healthy | Housing Cost Burden |
| 115 | 2,755 | Bath County | 33.1 | Healthy | Income & Poverty |
| 116 | 2,758 | Clarke County | 33.0 | Healthy | Housing Cost Burden |
| 117 | 2,773 | Frederick County | 32.7 | Healthy | Employment & Wages |
| 118 | 2,774 | Fairfax city | 32.7 | Healthy | Housing Cost Burden |
| 119 | 2,864 | Albemarle County | 30.6 | Healthy | Housing Cost Burden |
| 120 | 2,874 | Roanoke County | 30.3 | Healthy | Employment & Wages |
| 121 | 2,878 | Madison County | 30.2 | Healthy | Employment & Wages |
| 122 | 2,924 | Fauquier County | 28.9 | Healthy | Housing Cost Burden |
| 123 | 2,980 | King George County | 27.1 | Healthy | Housing Cost Burden |
| 124 | 2,987 | New Kent County | 26.9 | Healthy | Housing Cost Burden |
| 125 | 2,990 | Hanover County | 26.8 | Healthy | Employment & Wages |
| 126 | 2,993 | Poquoson city | 26.7 | Healthy | Employment & Wages |
| 127 | 2,997 | Fairfax County | 26.6 | Healthy | Housing Cost Burden |
| 128 | 3,016 | Falls Church city | 25.9 | Healthy | Housing Cost Burden |
| 129 | 3,041 | Powhatan County | 24.6 | Healthy | Employment & Wages |
| 130 | 3,075 | Loudoun County | 22.8 | Healthy | Housing Cost Burden |
| 131 | 3,092 | Arlington County | 21.9 | Healthy | Housing Cost Burden |
| 132 | 3,109 | Botetourt County | 20.8 | Healthy | Employment & Wages |
| 133 | 3,143 | Goochland County | 13.9 | Healthy | Housing Cost Burden |
2 of 133 county reports for Virginia are currently available. All 133 counties are scored and visible on the map above. New county reports are published weekly.
How County Scores Work
Each county is scored 0–100 using percentile-rank averaging across five data domains: Debt & Delinquency, Income & Poverty, Housing Cost Burden, Employment & Wages, and Community Vulnerability. A score of 50 means the county falls at the national median. Higher scores indicate greater financial distress.