Utah County Distress Index
Financial distress scores for all 29 counties in Utah, scored 0–100 across five domains. Mean score: 38.9.
Data: Census, BLS, Urban Institute, HUD, US Courts | Scores as of 2026-03-17
Utah Snapshot
Utah County Map
Loading interactive map…
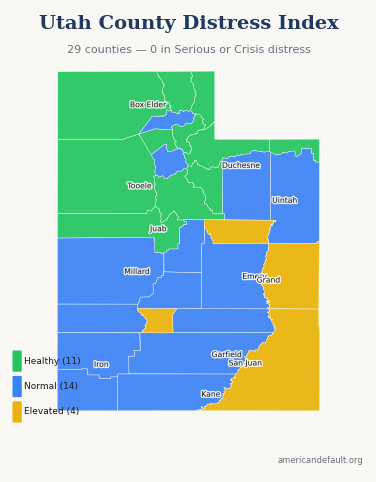
All 29 Utah counties colored by distress zone. Hover for details; click released counties for full reports.
Most & Least Distressed
Most Distressed
Least Distressed
Score Distribution
How Utah's 29 county scores are distributed across the 0–100 scale.
All Utah Counties
29 counties ranked by distress score. Click column headers to sort.
| State Rank | Nat'l Rank | County | Score | Zone | Primary Driver |
|---|---|---|---|---|---|
| 1 | 560 | San Juan County | 64.0 | Elevated | Community Vulnerability |
| 2 | 914 | Grand County | 58.9 | Elevated | Housing Cost Burden |
| 3 | 1,184 | Carbon County | 55.3 | Elevated | Income & Poverty |
| 4 | 1,230 | Piute County | 54.7 | Elevated | Community Vulnerability |
| 5 | 1,805 | Washington County | 47.3 | Normal | Housing Cost Burden |
| 6 | 1,924 | Kane County | 45.7 | Normal | Community Vulnerability |
| 7 | 1,990 | Sanpete County | 45.0 | Normal | Housing Cost Burden |
| 8 | 2,126 | Garfield County | 43.4 | Normal | Employment & Wages |
| 9 | 2,201 | Duchesne County | 42.1 | Normal | Community Vulnerability |
| 10 | 2,238 | Wayne County | 41.6 | Normal | Employment & Wages |
| 11 | 2,251 | Uintah County | 41.5 | Normal | Community Vulnerability |
| 12 | 2,254 | Iron County | 41.5 | Normal | Housing Cost Burden |
| 13 | 2,276 | Weber County | 41.2 | Normal | Housing Cost Burden |
| 14 | 2,320 | Salt Lake County | 40.5 | Normal | Housing Cost Burden |
| 15 | 2,345 | Sevier County | 40.0 | Normal | Employment & Wages |
| 16 | 2,377 | Beaver County | 39.5 | Normal | Community Vulnerability |
| 17 | 2,497 | Emery County | 37.8 | Normal | Community Vulnerability |
| 18 | 2,544 | Millard County | 36.9 | Normal | Community Vulnerability |
| 19 | 2,763 | Cache County | 32.9 | Healthy | Housing Cost Burden |
| 20 | 2,766 | Daggett County | 32.8 | Healthy | Employment & Wages |
| 21 | 2,779 | Utah County | 32.5 | Healthy | Housing Cost Burden |
| 22 | 2,827 | Juab County | 31.5 | Healthy | Employment & Wages |
| 23 | 2,863 | Tooele County | 30.6 | Healthy | Debt & Delinquency |
| 24 | 2,891 | Box Elder County | 29.8 | Healthy | Housing Cost Burden |
| 25 | 2,942 | Rich County | 28.4 | Healthy | Community Vulnerability |
| 26 | 2,951 | Davis County | 28.1 | Healthy | Housing Cost Burden |
| 27 | 3,037 | Wasatch County | 24.9 | Healthy | Housing Cost Burden |
| 28 | 3,102 | Summit County | 21.1 | Healthy | Housing Cost Burden |
| 29 | 3,123 | Morgan County | 19.0 | Healthy | Employment & Wages |
1 of 29 county reports for Utah are currently available. All 29 counties are scored and visible on the map above. New county reports are published weekly.
How County Scores Work
Each county is scored 0–100 using percentile-rank averaging across five data domains: Debt & Delinquency, Income & Poverty, Housing Cost Burden, Employment & Wages, and Community Vulnerability. A score of 50 means the county falls at the national median. Higher scores indicate greater financial distress.