South Carolina County Distress Index
Financial distress scores for all 46 counties in South Carolina, scored 0–100 across five domains. Mean score: 60.6. 17counties are in Serious Stress or Crisis.
Data: Census, BLS, Urban Institute, HUD, US Courts | Scores as of 2026-03-17
South Carolina Snapshot
South Carolina County Map
Loading interactive map…
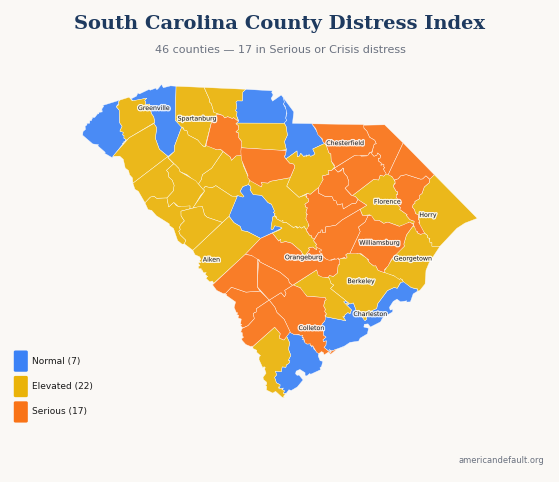
All 46 South Carolina counties colored by distress zone. Hover for details; click released counties for full reports.
Most & Least Distressed
Most Distressed
Least Distressed
Score Distribution
How South Carolina's 46 county scores are distributed across the 0–100 scale.
All South Carolina Counties
46 counties ranked by distress score. Click column headers to sort.
| State Rank | Nat'l Rank | County | Score | Zone | Primary Driver |
|---|---|---|---|---|---|
| 1 | 66 | Barnwell County | 74.9 | Serious Stress | Income & Poverty |
| 2 | 72 | Union County | 74.8 | Serious Stress | Income & Poverty |
| 3 | 76 | Williamsburg County | 74.5 | Serious Stress | Income & Poverty |
| 4 | 79 | Bamberg County | 74.4 | Serious Stress | Income & Poverty |
| 5 | 83 | Marlboro County | 74.1 | Serious Stress | Income & Poverty |
| 6 | 107 | Dillon County | 72.8 | Serious Stress | Income & Poverty |
| 7 | 131 | Colleton County | 72.0 | Serious Stress | Income & Poverty |
| 8 | 166 | Hampton County | 70.9 | Serious Stress | Income & Poverty |
| 9 | 207 | Clarendon County | 70.1 | Serious Stress | Income & Poverty |
| 10 | 237 | Fairfield County | 69.5 | Serious Stress | Income & Poverty |
| 11 | 238 | Darlington County | 69.4 | Serious Stress | Income & Poverty |
| 12 | 256 | Lee County | 69.1 | Serious Stress | Income & Poverty |
| 13 | 280 | Allendale County | 68.6 | Serious Stress | Income & Poverty |
| 14 | 295 | Chesterfield County | 68.3 | Serious Stress | Income & Poverty |
| 15 | 346 | Marion County | 67.4 | Serious Stress | Income & Poverty |
| 16 | 373 | Sumter County | 67.1 | Serious Stress | Debt & Delinquency |
| 17 | 478 | Orangeburg County | 65.4 | Serious Stress | Debt & Delinquency |
| 18 | 537 | Laurens County | 64.4 | Elevated | Community Vulnerability |
| 19 | 561 | Chester County | 64.0 | Elevated | Income & Poverty |
| 20 | 598 | Florence County | 63.4 | Elevated | Debt & Delinquency |
| 21 | 649 | Saluda County | 62.6 | Elevated | Community Vulnerability |
| 22 | 715 | Richland County | 61.5 | Elevated | Housing Cost Burden |
| 23 | 721 | Horry County | 61.4 | Elevated | Community Vulnerability |
| 24 | 727 | Jasper County | 61.4 | Elevated | Income & Poverty |
| 25 | 792 | Newberry County | 60.6 | Elevated | Income & Poverty |
| 26 | 843 | Pickens County | 59.8 | Elevated | Housing Cost Burden |
| 27 | 899 | Edgefield County | 59.1 | Elevated | Debt & Delinquency |
| 28 | 945 | Cherokee County | 58.4 | Elevated | Debt & Delinquency |
| 29 | 958 | Calhoun County | 58.4 | Elevated | Debt & Delinquency |
| 30 | 1,205 | Greenwood County | 55.1 | Elevated | Debt & Delinquency |
| 31 | 1,235 | Dorchester County | 54.7 | Elevated | Housing Cost Burden |
| 32 | 1,258 | Abbeville County | 54.3 | Elevated | Debt & Delinquency |
| 33 | 1,275 | Spartanburg County | 54.1 | Elevated | Housing Cost Burden |
| 34 | 1,326 | Anderson County | 53.6 | Elevated | Employment & Wages |
| 35 | 1,392 | Kershaw County | 52.7 | Elevated | Debt & Delinquency |
| 36 | 1,407 | Georgetown County | 52.6 | Elevated | Employment & Wages |
| 37 | 1,443 | Aiken County | 52.2 | Elevated | Debt & Delinquency |
| 38 | 1,486 | McCormick County | 51.4 | Elevated | Income & Poverty |
| 39 | 1,558 | Berkeley County | 50.5 | Elevated | Debt & Delinquency |
| 40 | 1,722 | Oconee County | 48.3 | Normal | Community Vulnerability |
| 41 | 1,860 | Charleston County | 46.5 | Normal | Housing Cost Burden |
| 42 | 1,897 | Lexington County | 46.0 | Normal | Debt & Delinquency |
| 43 | 1,899 | York County | 46.0 | Normal | Housing Cost Burden |
| 44 | 1,911 | Beaufort County | 45.9 | Normal | Housing Cost Burden |
| 45 | 1,979 | Greenville County | 45.1 | Normal | Housing Cost Burden |
| 46 | 2,359 | Lancaster County | 39.8 | Normal | Debt & Delinquency |
0 of 46 county reports for South Carolina are currently available. All 46 counties are scored and visible on the map above. New county reports are published weekly.
How County Scores Work
Each county is scored 0–100 using percentile-rank averaging across five data domains: Debt & Delinquency, Income & Poverty, Housing Cost Burden, Employment & Wages, and Community Vulnerability. A score of 50 means the county falls at the national median. Higher scores indicate greater financial distress.