Oregon County Distress Index
Financial distress scores for all 36 counties in Oregon, scored 0–100 across five domains. Mean score: 54.3. 2counties are in Serious Stress or Crisis.
Data: Census, BLS, Urban Institute, HUD, US Courts | Scores as of 2026-03-17
Oregon Snapshot
Oregon County Map
Loading interactive map…
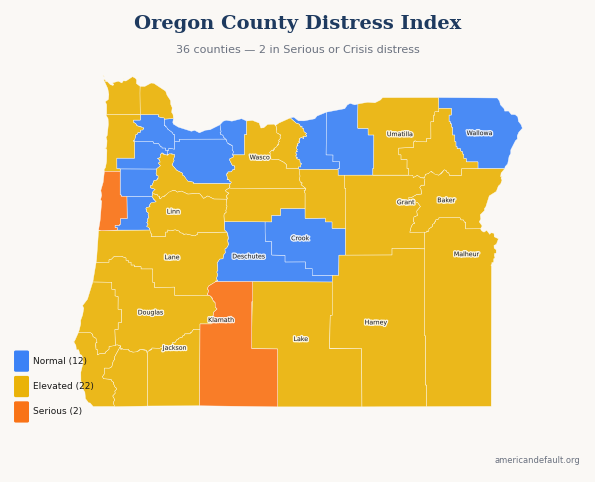
All 36 Oregon counties colored by distress zone. Hover for details; click released counties for full reports.
Most & Least Distressed
Most Distressed
Least Distressed
Score Distribution
How Oregon's 36 county scores are distributed across the 0–100 scale.
All Oregon Counties
36 counties ranked by distress score. Click column headers to sort.
| State Rank | Nat'l Rank | County | Score | Zone | Primary Driver |
|---|---|---|---|---|---|
| 1 | 193 | Klamath County | 70.4 | Serious Stress | Income & Poverty |
| 2 | 455 | Lincoln County | 65.8 | Serious Stress | Housing Cost Burden |
| 3 | 529 | Josephine County | 64.5 | Elevated | Housing Cost Burden |
| 4 | 564 | Malheur County | 64.0 | Elevated | Income & Poverty |
| 5 | 621 | Lake County | 63.0 | Elevated | Income & Poverty |
| 6 | 640 | Coos County | 62.6 | Elevated | Housing Cost Burden |
| 7 | 652 | Wheeler County | 62.5 | Elevated | Income & Poverty |
| 8 | 661 | Curry County | 62.4 | Elevated | Income & Poverty |
| 9 | 702 | Douglas County | 61.8 | Elevated | Employment & Wages |
| 10 | 712 | Wasco County | 61.6 | Elevated | Housing Cost Burden |
| 11 | 756 | Linn County | 61.0 | Elevated | Housing Cost Burden |
| 12 | 794 | Umatilla County | 60.5 | Elevated | Employment & Wages |
| 13 | 810 | Jefferson County | 60.3 | Elevated | Housing Cost Burden |
| 14 | 885 | Clatsop County | 59.3 | Elevated | Housing Cost Burden |
| 15 | 975 | Marion County | 58.2 | Elevated | Housing Cost Burden |
| 16 | 982 | Union County | 58.1 | Elevated | Employment & Wages |
| 17 | 989 | Lane County | 58.0 | Elevated | Housing Cost Burden |
| 18 | 1,023 | Grant County | 57.6 | Elevated | Community Vulnerability |
| 19 | 1,116 | Harney County | 56.4 | Elevated | Income & Poverty |
| 20 | 1,194 | Baker County | 55.2 | Elevated | Income & Poverty |
| 21 | 1,252 | Jackson County | 54.5 | Elevated | Housing Cost Burden |
| 22 | 1,471 | Sherman County | 51.7 | Elevated | Employment & Wages |
| 23 | 1,506 | Tillamook County | 51.1 | Elevated | Employment & Wages |
| 24 | 1,562 | Columbia County | 50.4 | Elevated | Housing Cost Burden |
| 25 | 1,635 | Polk County | 49.4 | Normal | Housing Cost Burden |
| 26 | 1,639 | Yamhill County | 49.4 | Normal | Housing Cost Burden |
| 27 | 1,725 | Multnomah County | 48.3 | Normal | Housing Cost Burden |
| 28 | 1,745 | Wallowa County | 48.0 | Normal | Community Vulnerability |
| 29 | 1,753 | Crook County | 47.9 | Normal | Housing Cost Burden |
| 30 | 1,822 | Benton County | 47.1 | Normal | Housing Cost Burden |
| 31 | 2,226 | Hood River County | 41.8 | Normal | Housing Cost Burden |
| 32 | 2,261 | Morrow County | 41.4 | Normal | Community Vulnerability |
| 33 | 2,376 | Deschutes County | 39.5 | Normal | Housing Cost Burden |
| 34 | 2,456 | Clackamas County | 38.3 | Normal | Housing Cost Burden |
| 35 | 2,584 | Washington County | 36.1 | Normal | Housing Cost Burden |
| 36 | 2,606 | Gilliam County | 35.8 | Normal | Community Vulnerability |
0 of 36 county reports for Oregon are currently available. All 36 counties are scored and visible on the map above. New county reports are published weekly.
How County Scores Work
Each county is scored 0–100 using percentile-rank averaging across five data domains: Debt & Delinquency, Income & Poverty, Housing Cost Burden, Employment & Wages, and Community Vulnerability. A score of 50 means the county falls at the national median. Higher scores indicate greater financial distress.