Ohio County Distress Index
Financial distress scores for all 88 counties in Ohio, scored 0–100 across five domains. Mean score: 48.9. 7counties are in Serious Stress or Crisis.
Data: Census, BLS, Urban Institute, HUD, US Courts | Scores as of 2026-03-17
Ohio Snapshot
Ohio County Map
Loading interactive map…
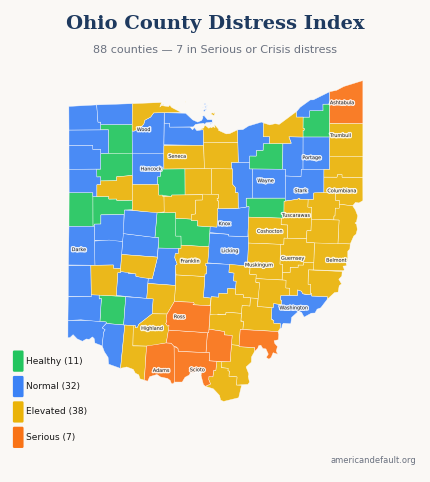
All 88 Ohio counties colored by distress zone. Hover for details; click released counties for full reports.
Most & Least Distressed
Most Distressed
Least Distressed
Score Distribution
How Ohio's 88 county scores are distributed across the 0–100 scale.
All Ohio Counties
88 counties ranked by distress score. Click column headers to sort.
| State Rank | Nat'l Rank | County | Score | Zone | Primary Driver |
|---|---|---|---|---|---|
| 1 | 261 | Adams County | 68.9 | Serious Stress | Income & Poverty |
| 2 | 282 | Ashtabula County | 68.6 | Serious Stress | Income & Poverty |
| 3 | 286 | Scioto County | 68.5 | Serious Stress | Income & Poverty |
| 4 | 289 | Jackson County | 68.5 | Serious Stress | Income & Poverty |
| 5 | 298 | Meigs County | 68.3 | Serious Stress | Income & Poverty |
| 6 | 335 | Pike County | 67.6 | Serious Stress | Income & Poverty |
| 7 | 445 | Ross County | 65.9 | Serious Stress | Debt & Delinquency |
| 8 | 520 | Trumbull County | 64.7 | Elevated | Income & Poverty |
| 9 | 530 | Guernsey County | 64.5 | Elevated | Income & Poverty |
| 10 | 543 | Athens County | 64.3 | Elevated | Income & Poverty |
| 11 | 563 | Gallia County | 64.0 | Elevated | Income & Poverty |
| 12 | 600 | Vinton County | 63.4 | Elevated | Income & Poverty |
| 13 | 604 | Clark County | 63.4 | Elevated | Debt & Delinquency |
| 14 | 623 | Lawrence County | 63.0 | Elevated | Debt & Delinquency |
| 15 | 679 | Mahoning County | 62.1 | Elevated | Income & Poverty |
| 16 | 708 | Marion County | 61.6 | Elevated | Debt & Delinquency |
| 17 | 744 | Coshocton County | 61.1 | Elevated | Income & Poverty |
| 18 | 777 | Hocking County | 60.8 | Elevated | Employment & Wages |
| 19 | 791 | Jefferson County | 60.6 | Elevated | Income & Poverty |
| 20 | 814 | Columbiana County | 60.3 | Elevated | Income & Poverty |
| 21 | 837 | Montgomery County | 59.9 | Elevated | Housing Cost Burden |
| 22 | 840 | Muskingum County | 59.9 | Elevated | Income & Poverty |
| 23 | 855 | Morgan County | 59.7 | Elevated | Income & Poverty |
| 24 | 937 | Lucas County | 58.5 | Elevated | Debt & Delinquency |
| 25 | 998 | Highland County | 57.9 | Elevated | Employment & Wages |
| 26 | 1,001 | Brown County | 57.9 | Elevated | Debt & Delinquency |
| 27 | 1,036 | Fayette County | 57.5 | Elevated | Debt & Delinquency |
| 28 | 1,059 | Perry County | 57.3 | Elevated | Debt & Delinquency |
| 29 | 1,071 | Richland County | 57.2 | Elevated | Income & Poverty |
| 30 | 1,076 | Harrison County | 57.1 | Elevated | Community Vulnerability |
| 31 | 1,084 | Belmont County | 57.0 | Elevated | Income & Poverty |
| 32 | 1,214 | Monroe County | 55.0 | Elevated | Employment & Wages |
| 33 | 1,243 | Hardin County | 54.6 | Elevated | Employment & Wages |
| 34 | 1,254 | Huron County | 54.5 | Elevated | Employment & Wages |
| 35 | 1,308 | Allen County | 53.8 | Elevated | Debt & Delinquency |
| 36 | 1,313 | Cuyahoga County | 53.7 | Elevated | Housing Cost Burden |
| 37 | 1,348 | Tuscarawas County | 53.3 | Elevated | Employment & Wages |
| 38 | 1,371 | Crawford County | 53.0 | Elevated | Employment & Wages |
| 39 | 1,455 | Erie County | 52.0 | Elevated | Employment & Wages |
| 40 | 1,464 | Franklin County | 51.8 | Elevated | Housing Cost Burden |
| 41 | 1,504 | Carroll County | 51.1 | Elevated | Employment & Wages |
| 42 | 1,505 | Morrow County | 51.1 | Elevated | Employment & Wages |
| 43 | 1,555 | Noble County | 50.5 | Elevated | Employment & Wages |
| 44 | 1,557 | Pickaway County | 50.5 | Elevated | Employment & Wages |
| 45 | 1,590 | Seneca County | 50.1 | Elevated | Employment & Wages |
| 46 | 1,657 | Williams County | 49.2 | Normal | Employment & Wages |
| 47 | 1,678 | Summit County | 49.0 | Normal | Housing Cost Burden |
| 48 | 1,723 | Hamilton County | 48.3 | Normal | Housing Cost Burden |
| 49 | 1,724 | Portage County | 48.3 | Normal | Housing Cost Burden |
| 50 | 1,776 | Washington County | 47.7 | Normal | Employment & Wages |
| 51 | 1,789 | Ashland County | 47.5 | Normal | Employment & Wages |
| 52 | 1,797 | Lorain County | 47.5 | Normal | Housing Cost Burden |
| 53 | 1,833 | Sandusky County | 46.9 | Normal | Employment & Wages |
| 54 | 1,867 | Stark County | 46.4 | Normal | Debt & Delinquency |
| 55 | 1,905 | Clinton County | 46.0 | Normal | Debt & Delinquency |
| 56 | 1,906 | Knox County | 46.0 | Normal | Employment & Wages |
| 57 | 2,086 | Madison County | 43.9 | Normal | Employment & Wages |
| 58 | 2,089 | Butler County | 43.9 | Normal | Housing Cost Burden |
| 59 | 2,116 | Paulding County | 43.5 | Normal | Employment & Wages |
| 60 | 2,121 | Licking County | 43.5 | Normal | Housing Cost Burden |
| 61 | 2,172 | Miami County | 42.6 | Normal | Employment & Wages |
| 62 | 2,184 | Champaign County | 42.4 | Normal | Debt & Delinquency |
| 63 | 2,206 | Lake County | 42.1 | Normal | Housing Cost Burden |
| 64 | 2,215 | Clermont County | 41.9 | Normal | Employment & Wages |
| 65 | 2,221 | Fairfield County | 41.9 | Normal | Housing Cost Burden |
| 66 | 2,243 | Logan County | 41.6 | Normal | Debt & Delinquency |
| 67 | 2,335 | Preble County | 40.2 | Normal | Debt & Delinquency |
| 68 | 2,412 | Shelby County | 39.0 | Normal | Debt & Delinquency |
| 69 | 2,422 | Van Wert County | 38.7 | Normal | Employment & Wages |
| 70 | 2,442 | Darke County | 38.6 | Normal | Employment & Wages |
| 71 | 2,462 | Ottawa County | 38.2 | Normal | Employment & Wages |
| 72 | 2,466 | Wayne County | 38.2 | Normal | Community Vulnerability |
| 73 | 2,512 | Defiance County | 37.5 | Normal | Employment & Wages |
| 74 | 2,522 | Hancock County | 37.3 | Normal | Debt & Delinquency |
| 75 | 2,559 | Fulton County | 36.6 | Normal | Employment & Wages |
| 76 | 2,623 | Greene County | 35.5 | Normal | Housing Cost Burden |
| 77 | 2,625 | Wood County | 35.5 | Normal | Housing Cost Burden |
| 78 | 2,830 | Henry County | 31.5 | Healthy | Employment & Wages |
| 79 | 2,893 | Auglaize County | 29.8 | Healthy | Employment & Wages |
| 80 | 2,912 | Wyandot County | 29.2 | Healthy | Debt & Delinquency |
| 81 | 2,982 | Holmes County | 27.1 | Healthy | Community Vulnerability |
| 82 | 2,988 | Medina County | 26.9 | Healthy | Employment & Wages |
| 83 | 3,034 | Geauga County | 25.3 | Healthy | Employment & Wages |
| 84 | 3,078 | Putnam County | 22.5 | Healthy | Employment & Wages |
| 85 | 3,093 | Mercer County | 21.8 | Healthy | Employment & Wages |
| 86 | 3,100 | Warren County | 21.2 | Healthy | Housing Cost Burden |
| 87 | 3,101 | Union County | 21.2 | Healthy | Employment & Wages |
| 88 | 3,125 | Delaware County | 18.8 | Healthy | Housing Cost Burden |
2 of 88 county reports for Ohio are currently available. All 88 counties are scored and visible on the map above. New county reports are published weekly.
How County Scores Work
Each county is scored 0–100 using percentile-rank averaging across five data domains: Debt & Delinquency, Income & Poverty, Housing Cost Burden, Employment & Wages, and Community Vulnerability. A score of 50 means the county falls at the national median. Higher scores indicate greater financial distress.