New York County Distress Index
Financial distress scores for all 62 counties in New York, scored 0–100 across five domains. Mean score: 47.5. 1county is in Serious Stress or Crisis.
Data: Census, BLS, Urban Institute, HUD, US Courts | Scores as of 2026-03-17
New York Snapshot
New York County Map
Loading interactive map…
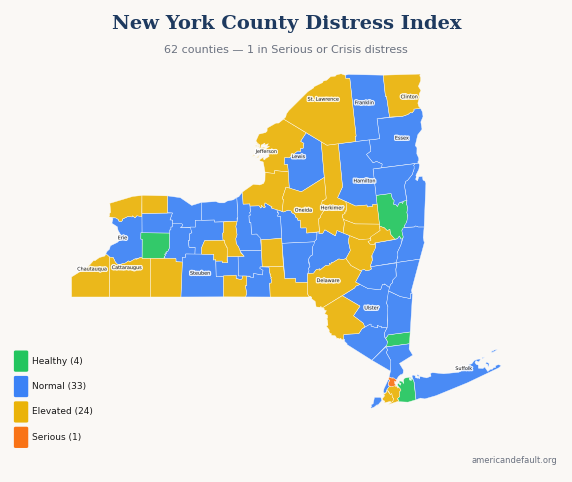
All 62 New York counties colored by distress zone. Hover for details; click released counties for full reports.
Most & Least Distressed
Most Distressed
Least Distressed
Score Distribution
How New York's 62 county scores are distributed across the 0–100 scale.
All New York Counties
62 counties ranked by distress score. Click column headers to sort.
| State Rank | Nat'l Rank | County | Score | Zone | Primary Driver |
|---|---|---|---|---|---|
| 1 | 21 | Bronx County | 77.7 | Serious Stress | Income & Poverty |
| 2 | 627 | Montgomery County | 62.9 | Elevated | Income & Poverty |
| 3 | 785 | Seneca County | 60.6 | Elevated | Housing Cost Burden |
| 4 | 938 | Chautauqua County | 58.5 | Elevated | Income & Poverty |
| 5 | 959 | Chemung County | 58.4 | Elevated | Housing Cost Burden |
| 6 | 990 | Cattaraugus County | 58.0 | Elevated | Income & Poverty |
| 7 | 1,089 | Kings County | 56.8 | Elevated | Housing Cost Burden |
| 8 | 1,144 | St. Lawrence County | 56.0 | Elevated | Income & Poverty |
| 9 | 1,212 | Oswego County | 55.0 | Elevated | Employment & Wages |
| 10 | 1,278 | Jefferson County | 54.1 | Elevated | Housing Cost Burden |
| 11 | 1,285 | Orleans County | 54.0 | Elevated | Employment & Wages |
| 12 | 1,346 | Queens County | 53.3 | Elevated | Housing Cost Burden |
| 13 | 1,356 | Clinton County | 53.2 | Elevated | Housing Cost Burden |
| 14 | 1,360 | Cortland County | 53.2 | Elevated | Employment & Wages |
| 15 | 1,405 | Fulton County | 52.6 | Elevated | Employment & Wages |
| 16 | 1,415 | Niagara County | 52.5 | Elevated | Employment & Wages |
| 17 | 1,422 | Sullivan County | 52.4 | Elevated | Housing Cost Burden |
| 18 | 1,433 | Broome County | 52.3 | Elevated | Housing Cost Burden |
| 19 | 1,460 | Oneida County | 51.8 | Elevated | Housing Cost Burden |
| 20 | 1,534 | Herkimer County | 50.8 | Elevated | Employment & Wages |
| 21 | 1,544 | Delaware County | 50.6 | Elevated | Income & Poverty |
| 22 | 1,551 | Yates County | 50.5 | Elevated | Employment & Wages |
| 23 | 1,554 | Schoharie County | 50.5 | Elevated | Employment & Wages |
| 24 | 1,561 | Schenectady County | 50.4 | Elevated | Housing Cost Burden |
| 25 | 1,587 | Allegany County | 50.1 | Elevated | Employment & Wages |
| 26 | 1,668 | Chenango County | 49.0 | Normal | Income & Poverty |
| 27 | 1,677 | Franklin County | 49.0 | Normal | Income & Poverty |
| 28 | 1,688 | Washington County | 48.8 | Normal | Housing Cost Burden |
| 29 | 1,716 | Warren County | 48.4 | Normal | Housing Cost Burden |
| 30 | 1,752 | Monroe County | 47.9 | Normal | Housing Cost Burden |
| 31 | 1,784 | Tompkins County | 47.6 | Normal | Housing Cost Burden |
| 32 | 1,814 | Richmond County | 47.1 | Normal | Housing Cost Burden |
| 33 | 1,821 | Orange County | 47.1 | Normal | Housing Cost Burden |
| 34 | 1,845 | Ulster County | 46.8 | Normal | Housing Cost Burden |
| 35 | 1,885 | Schuyler County | 46.2 | Normal | Employment & Wages |
| 36 | 1,903 | Steuben County | 46.0 | Normal | Income & Poverty |
| 37 | 1,917 | Otsego County | 45.8 | Normal | Employment & Wages |
| 38 | 1,921 | Onondaga County | 45.7 | Normal | Housing Cost Burden |
| 39 | 1,927 | Erie County | 45.6 | Normal | Housing Cost Burden |
| 40 | 1,936 | Tioga County | 45.6 | Normal | Housing Cost Burden |
| 41 | 1,947 | Essex County | 45.4 | Normal | Employment & Wages |
| 42 | 1,949 | Livingston County | 45.4 | Normal | Employment & Wages |
| 43 | 1,961 | Cayuga County | 45.3 | Normal | Housing Cost Burden |
| 44 | 2,015 | Wayne County | 44.7 | Normal | Employment & Wages |
| 45 | 2,042 | Greene County | 44.4 | Normal | Housing Cost Burden |
| 46 | 2,102 | Rensselaer County | 43.8 | Normal | Housing Cost Burden |
| 47 | 2,174 | Columbia County | 42.5 | Normal | Housing Cost Burden |
| 48 | 2,187 | Rockland County | 42.4 | Normal | Housing Cost Burden |
| 49 | 2,228 | Madison County | 41.7 | Normal | Employment & Wages |
| 50 | 2,291 | Lewis County | 41.0 | Normal | Employment & Wages |
| 51 | 2,298 | Hamilton County | 40.9 | Normal | Employment & Wages |
| 52 | 2,325 | Genesee County | 40.4 | Normal | Employment & Wages |
| 53 | 2,393 | New York County | 39.3 | Normal | Housing Cost Burden |
| 54 | 2,441 | Dutchess County | 38.6 | Normal | Housing Cost Burden |
| 55 | 2,460 | Ontario County | 38.3 | Normal | Employment & Wages |
| 56 | 2,538 | Westchester County | 37.0 | Normal | Housing Cost Burden |
| 57 | 2,543 | Albany County | 36.9 | Normal | Housing Cost Burden |
| 58 | 2,648 | Suffolk County | 35.1 | Normal | Housing Cost Burden |
| 59 | 2,867 | Wyoming County | 30.6 | Healthy | Employment & Wages |
| 60 | 2,887 | Putnam County | 29.9 | Healthy | Housing Cost Burden |
| 61 | 2,900 | Saratoga County | 29.7 | Healthy | Housing Cost Burden |
| 62 | 2,910 | Nassau County | 29.3 | Healthy | Housing Cost Burden |
7 of 62 county reports for New York are currently available. All 62 counties are scored and visible on the map above. New county reports are published weekly.
How County Scores Work
Each county is scored 0–100 using percentile-rank averaging across five data domains: Debt & Delinquency, Income & Poverty, Housing Cost Burden, Employment & Wages, and Community Vulnerability. A score of 50 means the county falls at the national median. Higher scores indicate greater financial distress.