New Mexico County Distress Index
Financial distress scores for all 33 counties in New Mexico, scored 0–100 across five domains. Mean score: 60.2. 11counties are in Serious Stress or Crisis.
Data: Census, BLS, Urban Institute, HUD, US Courts | Scores as of 2026-03-17
New Mexico Snapshot
New Mexico County Map
Loading interactive map…
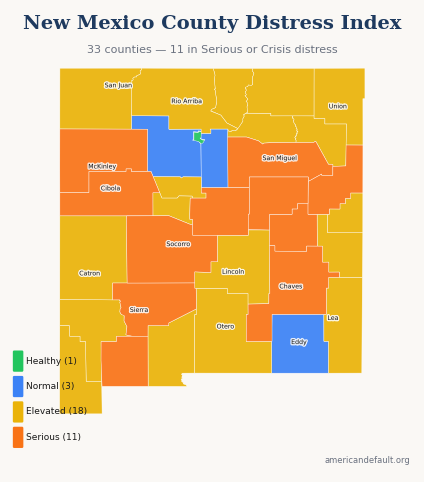
All 33 New Mexico counties colored by distress zone. Hover for details; click released counties for full reports.
Most & Least Distressed
Most Distressed
Least Distressed
Score Distribution
How New Mexico's 33 county scores are distributed across the 0–100 scale.
All New Mexico Counties
33 counties ranked by distress score. Click column headers to sort.
| State Rank | Nat'l Rank | County | Score | Zone | Primary Driver |
|---|---|---|---|---|---|
| 1 | 46 | McKinley County | 76.1 | Serious Stress | Income & Poverty |
| 2 | 58 | Cibola County | 75.5 | Serious Stress | Income & Poverty |
| 3 | 61 | Luna County | 75.4 | Serious Stress | Income & Poverty |
| 4 | 217 | Torrance County | 69.8 | Serious Stress | Income & Poverty |
| 5 | 266 | Socorro County | 68.8 | Serious Stress | Income & Poverty |
| 6 | 284 | De Baca County | 68.6 | Serious Stress | Employment & Wages |
| 7 | 285 | Chaves County | 68.5 | Serious Stress | Income & Poverty |
| 8 | 325 | Quay County | 67.7 | Serious Stress | Income & Poverty |
| 9 | 448 | Sierra County | 65.8 | Serious Stress | Income & Poverty |
| 10 | 459 | San Miguel County | 65.8 | Serious Stress | Income & Poverty |
| 11 | 466 | Guadalupe County | 65.6 | Serious Stress | Income & Poverty |
| 12 | 504 | Valencia County | 64.9 | Elevated | Employment & Wages |
| 13 | 538 | Roosevelt County | 64.4 | Elevated | Community Vulnerability |
| 14 | 570 | Hidalgo County | 63.9 | Elevated | Income & Poverty |
| 15 | 587 | Curry County | 63.6 | Elevated | Housing Cost Burden |
| 16 | 597 | Doña Ana County | 63.4 | Elevated | Housing Cost Burden |
| 17 | 603 | Otero County | 63.4 | Elevated | Income & Poverty |
| 18 | 619 | Union County | 63.1 | Elevated | Community Vulnerability |
| 19 | 620 | San Juan County | 63.1 | Elevated | Debt & Delinquency |
| 20 | 648 | Colfax County | 62.6 | Elevated | Community Vulnerability |
| 21 | 808 | Catron County | 60.4 | Elevated | Income & Poverty |
| 22 | 947 | Grant County | 58.4 | Elevated | Income & Poverty |
| 23 | 1,068 | Lincoln County | 57.2 | Elevated | Community Vulnerability |
| 24 | 1,088 | Taos County | 56.8 | Elevated | Income & Poverty |
| 25 | 1,247 | Rio Arriba County | 54.5 | Elevated | Income & Poverty |
| 26 | 1,295 | Lea County | 53.9 | Elevated | Debt & Delinquency |
| 27 | 1,370 | Mora County | 53.0 | Elevated | Income & Poverty |
| 28 | 1,391 | Bernalillo County | 52.8 | Elevated | Housing Cost Burden |
| 29 | 1,571 | Harding County | 50.3 | Elevated | Income & Poverty |
| 30 | 1,707 | Santa Fe County | 48.5 | Normal | Housing Cost Burden |
| 31 | 2,061 | Sandoval County | 44.2 | Normal | Employment & Wages |
| 32 | 2,079 | Eddy County | 44.0 | Normal | Debt & Delinquency |
| 33 | 3,144 | Los Alamos County | 13.3 | Healthy | Employment & Wages |
1 of 33 county reports for New Mexico are currently available. All 33 counties are scored and visible on the map above. New county reports are published weekly.
How County Scores Work
Each county is scored 0–100 using percentile-rank averaging across five data domains: Debt & Delinquency, Income & Poverty, Housing Cost Burden, Employment & Wages, and Community Vulnerability. A score of 50 means the county falls at the national median. Higher scores indicate greater financial distress.