New Jersey County Distress Index
Financial distress scores for all 21 counties in New Jersey, scored 0–100 across five domains. Mean score: 48.2. 2counties are in Serious Stress or Crisis.
Data: Census, BLS, Urban Institute, HUD, US Courts | Scores as of 2026-03-17
New Jersey Snapshot
New Jersey County Map
Loading interactive map…
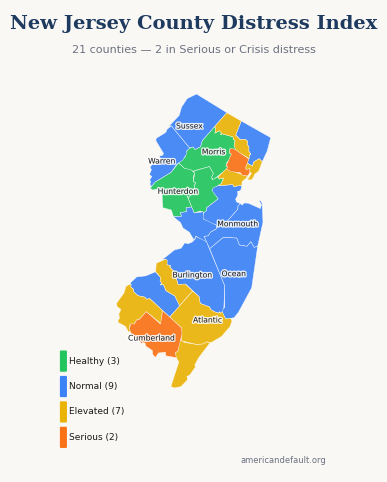
All 21 New Jersey counties colored by distress zone. Hover for details; click released counties for full reports.
Most & Least Distressed
Most Distressed
Least Distressed
Score Distribution
How New Jersey's 21 county scores are distributed across the 0–100 scale.
All New Jersey Counties
21 counties ranked by distress score. Click column headers to sort.
| State Rank | Nat'l Rank | County | Score | Zone | Primary Driver |
|---|---|---|---|---|---|
| 1 | 70 | Cumberland County | 74.9 | Serious Stress | Housing Cost Burden |
| 2 | 394 | Essex County | 66.7 | Serious Stress | Housing Cost Burden |
| 3 | 516 | Passaic County | 64.7 | Elevated | Housing Cost Burden |
| 4 | 593 | Atlantic County | 63.5 | Elevated | Housing Cost Burden |
| 5 | 743 | Camden County | 61.1 | Elevated | Housing Cost Burden |
| 6 | 817 | Hudson County | 60.2 | Elevated | Housing Cost Burden |
| 7 | 834 | Salem County | 59.9 | Elevated | Housing Cost Burden |
| 8 | 1,414 | Union County | 52.5 | Elevated | Housing Cost Burden |
| 9 | 1,495 | Cape May County | 51.2 | Elevated | Housing Cost Burden |
| 10 | 1,642 | Mercer County | 49.3 | Normal | Housing Cost Burden |
| 11 | 1,840 | Ocean County | 46.9 | Normal | Housing Cost Burden |
| 12 | 1,983 | Gloucester County | 45.0 | Normal | Housing Cost Burden |
| 13 | 2,123 | Middlesex County | 43.5 | Normal | Housing Cost Burden |
| 14 | 2,303 | Warren County | 40.8 | Normal | Housing Cost Burden |
| 15 | 2,414 | Burlington County | 38.9 | Normal | Housing Cost Burden |
| 16 | 2,533 | Bergen County | 37.1 | Normal | Housing Cost Burden |
| 17 | 2,586 | Sussex County | 36.1 | Normal | Housing Cost Burden |
| 18 | 2,590 | Monmouth County | 35.9 | Normal | Housing Cost Burden |
| 19 | 2,839 | Somerset County | 31.4 | Healthy | Housing Cost Burden |
| 20 | 2,996 | Hunterdon County | 26.6 | Healthy | Housing Cost Burden |
| 21 | 3,002 | Morris County | 26.4 | Healthy | Housing Cost Burden |
0 of 21 county reports for New Jersey are currently available. All 21 counties are scored and visible on the map above. New county reports are published weekly.
How County Scores Work
Each county is scored 0–100 using percentile-rank averaging across five data domains: Debt & Delinquency, Income & Poverty, Housing Cost Burden, Employment & Wages, and Community Vulnerability. A score of 50 means the county falls at the national median. Higher scores indicate greater financial distress.