Montana County Distress Index
Financial distress scores for all 56 counties in Montana, scored 0–100 across five domains. Mean score: 44.8. 1county is in Serious Stress or Crisis.
Data: Census, BLS, Urban Institute, HUD, US Courts | Scores as of 2026-03-17
Montana Snapshot
Montana County Map
Loading interactive map…
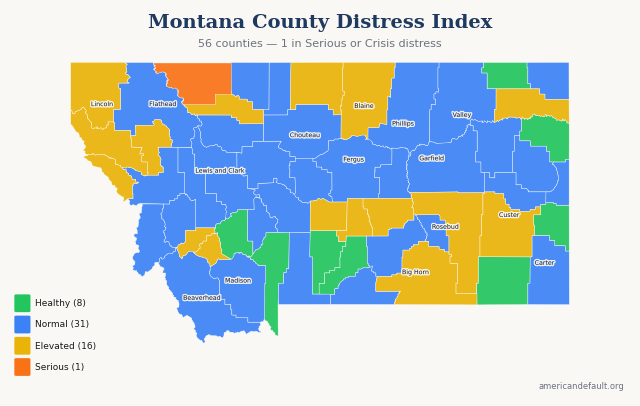
All 56 Montana counties colored by distress zone. Hover for details; click released counties for full reports.
Most & Least Distressed
Most Distressed
Least Distressed
Score Distribution
How Montana's 56 county scores are distributed across the 0–100 scale.
All Montana Counties
56 counties ranked by distress score. Click column headers to sort.
| State Rank | Nat'l Rank | County | Score | Zone | Primary Driver |
|---|---|---|---|---|---|
| 1 | 129 | Glacier County | 72.1 | Serious Stress | Income & Poverty |
| 2 | 514 | Big Horn County | 64.7 | Elevated | Income & Poverty |
| 3 | 552 | Roosevelt County | 64.2 | Elevated | Income & Poverty |
| 4 | 626 | Lincoln County | 62.9 | Elevated | Community Vulnerability |
| 5 | 720 | Sanders County | 61.4 | Elevated | Community Vulnerability |
| 6 | 1,011 | Blaine County | 57.8 | Elevated | Community Vulnerability |
| 7 | 1,026 | Rosebud County | 57.6 | Elevated | Community Vulnerability |
| 8 | 1,083 | Silver Bow County | 57.0 | Elevated | Housing Cost Burden |
| 9 | 1,091 | Musselshell County | 56.7 | Elevated | Community Vulnerability |
| 10 | 1,178 | Golden Valley County | 55.5 | Elevated | Community Vulnerability |
| 11 | 1,251 | Mineral County | 54.5 | Elevated | Employment & Wages |
| 12 | 1,318 | Wheatland County | 53.7 | Elevated | Income & Poverty |
| 13 | 1,448 | Pondera County | 52.1 | Elevated | Income & Poverty |
| 14 | 1,465 | Lake County | 51.8 | Elevated | Community Vulnerability |
| 15 | 1,475 | Custer County | 51.6 | Elevated | Housing Cost Burden |
| 16 | 1,509 | Hill County | 51.1 | Elevated | Income & Poverty |
| 17 | 1,578 | Deer Lodge County | 50.2 | Elevated | Community Vulnerability |
| 18 | 1,618 | Powell County | 49.6 | Normal | Community Vulnerability |
| 19 | 1,758 | Petroleum County | 47.9 | Normal | Employment & Wages |
| 20 | 1,763 | Garfield County | 47.8 | Normal | Income & Poverty |
| 21 | 1,794 | Cascade County | 47.5 | Normal | Housing Cost Burden |
| 22 | 1,853 | Wibaux County | 46.7 | Normal | Employment & Wages |
| 23 | 1,862 | Prairie County | 46.5 | Normal | Employment & Wages |
| 24 | 1,974 | Toole County | 45.1 | Normal | Income & Poverty |
| 25 | 1,987 | Fergus County | 45.0 | Normal | Employment & Wages |
| 26 | 1,992 | Valley County | 45.0 | Normal | Employment & Wages |
| 27 | 2,066 | Phillips County | 44.1 | Normal | Income & Poverty |
| 28 | 2,104 | Ravalli County | 43.7 | Normal | Community Vulnerability |
| 29 | 2,105 | Liberty County | 43.7 | Normal | Income & Poverty |
| 30 | 2,114 | Sheridan County | 43.6 | Normal | Community Vulnerability |
| 31 | 2,130 | Dawson County | 43.3 | Normal | Employment & Wages |
| 32 | 2,149 | Granite County | 42.9 | Normal | Employment & Wages |
| 33 | 2,183 | Carter County | 42.4 | Normal | Community Vulnerability |
| 34 | 2,246 | Park County | 41.5 | Normal | Housing Cost Burden |
| 35 | 2,283 | Yellowstone County | 41.1 | Normal | Housing Cost Burden |
| 36 | 2,309 | Treasure County | 40.8 | Normal | Employment & Wages |
| 37 | 2,339 | Missoula County | 40.1 | Normal | Housing Cost Burden |
| 38 | 2,354 | Meagher County | 39.9 | Normal | Income & Poverty |
| 39 | 2,356 | Flathead County | 39.9 | Normal | Housing Cost Burden |
| 40 | 2,378 | Chouteau County | 39.5 | Normal | Income & Poverty |
| 41 | 2,440 | Beaverhead County | 38.6 | Normal | Housing Cost Burden |
| 42 | 2,457 | Carbon County | 38.3 | Normal | Community Vulnerability |
| 43 | 2,472 | McCone County | 38.1 | Normal | Income & Poverty |
| 44 | 2,499 | Broadwater County | 37.8 | Normal | Housing Cost Burden |
| 45 | 2,532 | Judith Basin County | 37.1 | Normal | Income & Poverty |
| 46 | 2,552 | Teton County | 36.8 | Normal | Employment & Wages |
| 47 | 2,593 | Lewis and Clark County | 35.9 | Normal | Housing Cost Burden |
| 48 | 2,599 | Madison County | 35.8 | Normal | Employment & Wages |
| 49 | 2,674 | Gallatin County | 34.6 | Healthy | Housing Cost Burden |
| 50 | 2,810 | Fallon County | 31.8 | Healthy | Housing Cost Burden |
| 51 | 2,821 | Powder River County | 31.6 | Healthy | Income & Poverty |
| 52 | 2,925 | Richland County | 28.9 | Healthy | Debt & Delinquency |
| 53 | 2,959 | Sweet Grass County | 27.9 | Healthy | Community Vulnerability |
| 54 | 2,998 | Daniels County | 26.5 | Healthy | Income & Poverty |
| 55 | 3,003 | Jefferson County | 26.4 | Healthy | Employment & Wages |
| 56 | 3,091 | Stillwater County | 21.9 | Healthy | Community Vulnerability |
0 of 56 county reports for Montana are currently available. All 56 counties are scored and visible on the map above. New county reports are published weekly.
How County Scores Work
Each county is scored 0–100 using percentile-rank averaging across five data domains: Debt & Delinquency, Income & Poverty, Housing Cost Burden, Employment & Wages, and Community Vulnerability. A score of 50 means the county falls at the national median. Higher scores indicate greater financial distress.