Missouri County Distress Index
Financial distress scores for all 115 counties in Missouri, scored 0–100 across five domains. Mean score: 50.8. 13counties are in Serious Stress or Crisis.
Data: Census, BLS, Urban Institute, HUD, US Courts | Scores as of 2026-03-17
Missouri Snapshot
Missouri County Map
Loading interactive map…
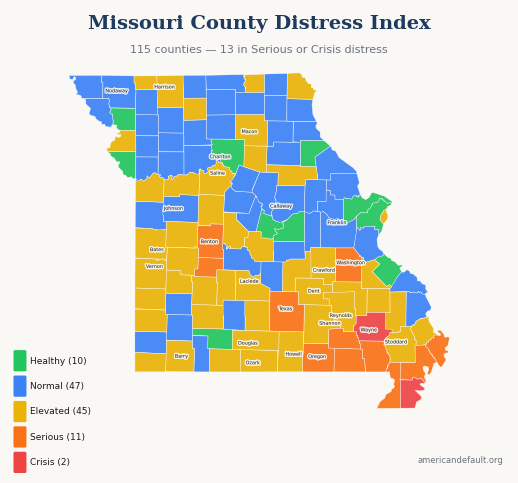
All 115 Missouri counties colored by distress zone. Hover for details; click released counties for full reports.
Most & Least Distressed
Most Distressed
Least Distressed
Score Distribution
How Missouri's 115 county scores are distributed across the 0–100 scale.
All Missouri Counties
115 counties ranked by distress score. Click column headers to sort.
| State Rank | Nat'l Rank | County | Score | Zone | Primary Driver |
|---|---|---|---|---|---|
| 1 | 1 | Pemiscot County | 82.9 | Crisis | Income & Poverty |
| 2 | 4 | Wayne County | 80.2 | Crisis | Income & Poverty |
| 3 | 5 | Dunklin County | 79.7 | Serious Stress | Debt & Delinquency |
| 4 | 30 | Ripley County | 77.0 | Serious Stress | Community Vulnerability |
| 5 | 37 | Mississippi County | 76.6 | Serious Stress | Income & Poverty |
| 6 | 114 | Oregon County | 72.5 | Serious Stress | Community Vulnerability |
| 7 | 134 | Carter County | 71.9 | Serious Stress | Community Vulnerability |
| 8 | 183 | Hickory County | 70.6 | Serious Stress | Income & Poverty |
| 9 | 223 | Texas County | 69.7 | Serious Stress | Community Vulnerability |
| 10 | 250 | Washington County | 69.2 | Serious Stress | Community Vulnerability |
| 11 | 330 | Butler County | 67.7 | Serious Stress | Community Vulnerability |
| 12 | 435 | Benton County | 66.1 | Serious Stress | Community Vulnerability |
| 13 | 462 | New Madrid County | 65.7 | Serious Stress | Debt & Delinquency |
| 14 | 519 | St. Clair County | 64.7 | Elevated | Community Vulnerability |
| 15 | 528 | Madison County | 64.6 | Elevated | Community Vulnerability |
| 16 | 591 | Ozark County | 63.5 | Elevated | Community Vulnerability |
| 17 | 596 | Morgan County | 63.4 | Elevated | Community Vulnerability |
| 18 | 618 | Cedar County | 63.1 | Elevated | Community Vulnerability |
| 19 | 647 | Iron County | 62.6 | Elevated | Income & Poverty |
| 20 | 668 | Shannon County | 62.3 | Elevated | Income & Poverty |
| 21 | 714 | Howell County | 61.5 | Elevated | Community Vulnerability |
| 22 | 716 | St. Francois County | 61.5 | Elevated | Community Vulnerability |
| 23 | 739 | St. Louis city | 61.2 | Elevated | Housing Cost Burden |
| 24 | 760 | Taney County | 60.9 | Elevated | Community Vulnerability |
| 25 | 762 | Reynolds County | 60.9 | Elevated | Income & Poverty |
| 26 | 800 | Dent County | 60.5 | Elevated | Community Vulnerability |
| 27 | 813 | Wright County | 60.3 | Elevated | Community Vulnerability |
| 28 | 846 | Henry County | 59.8 | Elevated | Community Vulnerability |
| 29 | 857 | McDonald County | 59.7 | Elevated | Income & Poverty |
| 30 | 860 | Buchanan County | 59.6 | Elevated | Community Vulnerability |
| 31 | 868 | Douglas County | 59.5 | Elevated | Income & Poverty |
| 32 | 898 | Barton County | 59.1 | Elevated | Community Vulnerability |
| 33 | 900 | Laclede County | 59.1 | Elevated | Community Vulnerability |
| 34 | 906 | Crawford County | 59.0 | Elevated | Community Vulnerability |
| 35 | 912 | Dallas County | 58.9 | Elevated | Community Vulnerability |
| 36 | 918 | Saline County | 58.8 | Elevated | Debt & Delinquency |
| 37 | 956 | Jasper County | 58.4 | Elevated | Debt & Delinquency |
| 38 | 1,008 | Stoddard County | 57.8 | Elevated | Community Vulnerability |
| 39 | 1,063 | Audrain County | 57.3 | Elevated | Community Vulnerability |
| 40 | 1,126 | Scott County | 56.3 | Elevated | Community Vulnerability |
| 41 | 1,129 | Bates County | 56.2 | Elevated | Community Vulnerability |
| 42 | 1,162 | Vernon County | 55.8 | Elevated | Community Vulnerability |
| 43 | 1,223 | Randolph County | 54.8 | Elevated | Debt & Delinquency |
| 44 | 1,260 | Bollinger County | 54.3 | Elevated | Debt & Delinquency |
| 45 | 1,273 | Pettis County | 54.2 | Elevated | Community Vulnerability |
| 46 | 1,276 | Barry County | 54.1 | Elevated | Community Vulnerability |
| 47 | 1,277 | Harrison County | 54.1 | Elevated | Income & Poverty |
| 48 | 1,280 | Clark County | 54.1 | Elevated | Debt & Delinquency |
| 49 | 1,302 | Schuyler County | 53.8 | Elevated | Community Vulnerability |
| 50 | 1,328 | Grundy County | 53.6 | Elevated | Income & Poverty |
| 51 | 1,352 | Polk County | 53.3 | Elevated | Community Vulnerability |
| 52 | 1,379 | Jackson County | 52.9 | Elevated | Housing Cost Burden |
| 53 | 1,469 | Worth County | 51.7 | Elevated | Community Vulnerability |
| 54 | 1,503 | Miller County | 51.1 | Elevated | Community Vulnerability |
| 55 | 1,512 | Greene County | 51.0 | Elevated | Housing Cost Burden |
| 56 | 1,560 | Macon County | 50.4 | Elevated | Community Vulnerability |
| 57 | 1,567 | Phelps County | 50.4 | Elevated | Housing Cost Burden |
| 58 | 1,586 | Lafayette County | 50.1 | Elevated | Debt & Delinquency |
| 59 | 1,626 | Lawrence County | 49.5 | Normal | Community Vulnerability |
| 60 | 1,636 | Pike County | 49.4 | Normal | Debt & Delinquency |
| 61 | 1,649 | Dade County | 49.3 | Normal | Community Vulnerability |
| 62 | 1,691 | Knox County | 48.8 | Normal | Income & Poverty |
| 63 | 1,759 | Howard County | 47.9 | Normal | Housing Cost Burden |
| 64 | 1,773 | Montgomery County | 47.7 | Normal | Community Vulnerability |
| 65 | 1,774 | Pulaski County | 47.7 | Normal | Community Vulnerability |
| 66 | 1,782 | Lewis County | 47.6 | Normal | Employment & Wages |
| 67 | 1,796 | Putnam County | 47.5 | Normal | Income & Poverty |
| 68 | 1,855 | Adair County | 46.6 | Normal | Income & Poverty |
| 69 | 1,900 | Monroe County | 46.0 | Normal | Community Vulnerability |
| 70 | 1,933 | Ray County | 45.6 | Normal | Employment & Wages |
| 71 | 1,935 | Stone County | 45.6 | Normal | Community Vulnerability |
| 72 | 1,942 | Linn County | 45.4 | Normal | Income & Poverty |
| 73 | 1,968 | Sullivan County | 45.2 | Normal | Income & Poverty |
| 74 | 1,970 | Maries County | 45.2 | Normal | Community Vulnerability |
| 75 | 2,072 | Carroll County | 44.0 | Normal | Debt & Delinquency |
| 76 | 2,075 | Gentry County | 44.0 | Normal | Community Vulnerability |
| 77 | 2,085 | Nodaway County | 43.9 | Normal | Housing Cost Burden |
| 78 | 2,091 | Newton County | 43.8 | Normal | Community Vulnerability |
| 79 | 2,093 | Webster County | 43.8 | Normal | Community Vulnerability |
| 80 | 2,097 | Johnson County | 43.8 | Normal | Debt & Delinquency |
| 81 | 2,153 | Caldwell County | 42.8 | Normal | Employment & Wages |
| 82 | 2,167 | Clinton County | 42.6 | Normal | Employment & Wages |
| 83 | 2,194 | Livingston County | 42.3 | Normal | Community Vulnerability |
| 84 | 2,217 | DeKalb County | 41.9 | Normal | Employment & Wages |
| 85 | 2,230 | Marion County | 41.7 | Normal | Debt & Delinquency |
| 86 | 2,233 | Camden County | 41.7 | Normal | Community Vulnerability |
| 87 | 2,244 | Scotland County | 41.5 | Normal | Community Vulnerability |
| 88 | 2,245 | Callaway County | 41.5 | Normal | Debt & Delinquency |
| 89 | 2,270 | Holt County | 41.3 | Normal | Community Vulnerability |
| 90 | 2,284 | Cape Girardeau County | 41.0 | Normal | Housing Cost Burden |
| 91 | 2,308 | Daviess County | 40.8 | Normal | Community Vulnerability |
| 92 | 2,341 | Gasconade County | 40.1 | Normal | Debt & Delinquency |
| 93 | 2,349 | Mercer County | 40.0 | Normal | Community Vulnerability |
| 94 | 2,373 | Shelby County | 39.6 | Normal | Community Vulnerability |
| 95 | 2,403 | Cooper County | 39.1 | Normal | Community Vulnerability |
| 96 | 2,413 | Boone County | 38.9 | Normal | Housing Cost Burden |
| 97 | 2,458 | Franklin County | 38.3 | Normal | Employment & Wages |
| 98 | 2,469 | Clay County | 38.1 | Normal | Housing Cost Burden |
| 99 | 2,479 | Warren County | 38.0 | Normal | Debt & Delinquency |
| 100 | 2,482 | Cass County | 37.9 | Normal | Debt & Delinquency |
| 101 | 2,483 | Lincoln County | 37.9 | Normal | Community Vulnerability |
| 102 | 2,488 | Atchison County | 37.9 | Normal | Community Vulnerability |
| 103 | 2,496 | Perry County | 37.8 | Normal | Debt & Delinquency |
| 104 | 2,612 | Jefferson County | 35.7 | Normal | Employment & Wages |
| 105 | 2,637 | Moniteau County | 35.3 | Normal | Community Vulnerability |
| 106 | 2,710 | Chariton County | 33.8 | Healthy | Community Vulnerability |
| 107 | 2,760 | St. Louis County | 33.0 | Healthy | Housing Cost Burden |
| 108 | 2,764 | Ralls County | 32.9 | Healthy | Debt & Delinquency |
| 109 | 2,765 | Andrew County | 32.8 | Healthy | Employment & Wages |
| 110 | 2,799 | Christian County | 32.0 | Healthy | Housing Cost Burden |
| 111 | 2,885 | Ste. Genevieve County | 30.1 | Healthy | Debt & Delinquency |
| 112 | 2,896 | Platte County | 29.8 | Healthy | Housing Cost Burden |
| 113 | 2,976 | Cole County | 27.2 | Healthy | Debt & Delinquency |
| 114 | 3,089 | St. Charles County | 22.0 | Healthy | Housing Cost Burden |
| 115 | 3,115 | Osage County | 19.8 | Healthy | Employment & Wages |
5 of 115 county reports for Missouri are currently available. All 115 counties are scored and visible on the map above. New county reports are published weekly.
How County Scores Work
Each county is scored 0–100 using percentile-rank averaging across five data domains: Debt & Delinquency, Income & Poverty, Housing Cost Burden, Employment & Wages, and Community Vulnerability. A score of 50 means the county falls at the national median. Higher scores indicate greater financial distress.