Minnesota County Distress Index
Financial distress scores for all 87 counties in Minnesota, scored 0–100 across five domains. Mean score: 36.8.
Data: Census, BLS, Urban Institute, HUD, US Courts | Scores as of 2026-03-17
Minnesota Snapshot
Minnesota County Map
Loading interactive map…
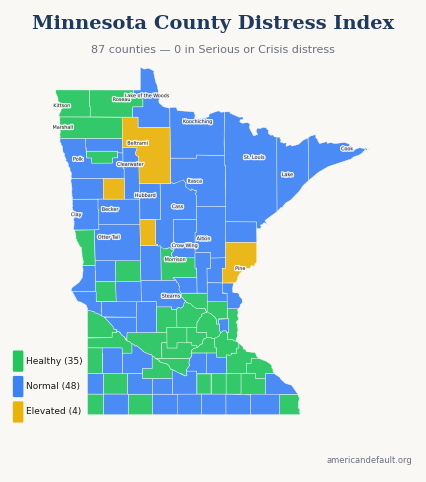
All 87 Minnesota counties colored by distress zone. Hover for details; click released counties for full reports.
Most & Least Distressed
Most Distressed
Least Distressed
Score Distribution
How Minnesota's 87 county scores are distributed across the 0–100 scale.
All Minnesota Counties
87 counties ranked by distress score. Click column headers to sort.
| State Rank | Nat'l Rank | County | Score | Zone | Primary Driver |
|---|---|---|---|---|---|
| 1 | 853 | Mahnomen County | 59.7 | Elevated | Income & Poverty |
| 2 | 1,228 | Beltrami County | 54.8 | Elevated | Employment & Wages |
| 3 | 1,523 | Wadena County | 50.9 | Elevated | Employment & Wages |
| 4 | 1,577 | Pine County | 50.2 | Elevated | Employment & Wages |
| 5 | 1,662 | Cass County | 49.1 | Normal | Employment & Wages |
| 6 | 1,683 | Itasca County | 48.8 | Normal | Employment & Wages |
| 7 | 1,777 | Aitkin County | 47.7 | Normal | Employment & Wages |
| 8 | 1,859 | Mille Lacs County | 46.5 | Normal | Employment & Wages |
| 9 | 1,889 | St. Louis County | 46.1 | Normal | Housing Cost Burden |
| 10 | 1,894 | Clearwater County | 46.0 | Normal | Community Vulnerability |
| 11 | 1,944 | Martin County | 45.4 | Normal | Employment & Wages |
| 12 | 2,008 | Ramsey County | 44.8 | Normal | Housing Cost Burden |
| 13 | 2,103 | Mower County | 43.7 | Normal | Employment & Wages |
| 14 | 2,118 | Swift County | 43.5 | Normal | Employment & Wages |
| 15 | 2,137 | Todd County | 43.2 | Normal | Employment & Wages |
| 16 | 2,138 | Nobles County | 43.2 | Normal | Employment & Wages |
| 17 | 2,163 | Benton County | 42.7 | Normal | Employment & Wages |
| 18 | 2,177 | Isanti County | 42.5 | Normal | Employment & Wages |
| 19 | 2,186 | Chippewa County | 42.4 | Normal | Employment & Wages |
| 20 | 2,193 | Blue Earth County | 42.3 | Normal | Housing Cost Burden |
| 21 | 2,202 | Kanabec County | 42.1 | Normal | Employment & Wages |
| 22 | 2,220 | Lake County | 41.9 | Normal | Employment & Wages |
| 23 | 2,242 | Koochiching County | 41.6 | Normal | Employment & Wages |
| 24 | 2,248 | Clay County | 41.5 | Normal | Housing Cost Burden |
| 25 | 2,253 | Hubbard County | 41.5 | Normal | Employment & Wages |
| 26 | 2,263 | Pennington County | 41.4 | Normal | Employment & Wages |
| 27 | 2,302 | Kandiyohi County | 40.8 | Normal | Employment & Wages |
| 28 | 2,332 | Faribault County | 40.2 | Normal | Employment & Wages |
| 29 | 2,334 | Freeborn County | 40.2 | Normal | Employment & Wages |
| 30 | 2,338 | Carlton County | 40.2 | Normal | Employment & Wages |
| 31 | 2,379 | Crow Wing County | 39.5 | Normal | Employment & Wages |
| 32 | 2,383 | Polk County | 39.5 | Normal | Housing Cost Burden |
| 33 | 2,388 | Becker County | 39.4 | Normal | Employment & Wages |
| 34 | 2,427 | Lyon County | 38.7 | Normal | Employment & Wages |
| 35 | 2,451 | Watonwan County | 38.3 | Normal | Employment & Wages |
| 36 | 2,463 | Stearns County | 38.2 | Normal | Housing Cost Burden |
| 37 | 2,492 | Norman County | 37.8 | Normal | Employment & Wages |
| 38 | 2,495 | Cottonwood County | 37.8 | Normal | Employment & Wages |
| 39 | 2,526 | Redwood County | 37.2 | Normal | Employment & Wages |
| 40 | 2,546 | Pipestone County | 36.9 | Normal | Employment & Wages |
| 41 | 2,554 | Winona County | 36.8 | Normal | Housing Cost Burden |
| 42 | 2,555 | Otter Tail County | 36.7 | Normal | Employment & Wages |
| 43 | 2,558 | Pope County | 36.6 | Normal | Employment & Wages |
| 44 | 2,566 | Cook County | 36.5 | Normal | Employment & Wages |
| 45 | 2,575 | Lake of the Woods County | 36.3 | Normal | Employment & Wages |
| 46 | 2,577 | Rice County | 36.3 | Normal | Employment & Wages |
| 47 | 2,579 | Chisago County | 36.2 | Normal | Employment & Wages |
| 48 | 2,583 | Big Stone County | 36.1 | Normal | Employment & Wages |
| 49 | 2,614 | Fillmore County | 35.7 | Normal | Employment & Wages |
| 50 | 2,638 | Grant County | 35.3 | Normal | Employment & Wages |
| 51 | 2,641 | Traverse County | 35.3 | Normal | Employment & Wages |
| 52 | 2,643 | Le Sueur County | 35.2 | Normal | Employment & Wages |
| 53 | 2,662 | McLeod County | 34.7 | Healthy | Employment & Wages |
| 54 | 2,671 | Renville County | 34.6 | Healthy | Employment & Wages |
| 55 | 2,678 | Waseca County | 34.4 | Healthy | Employment & Wages |
| 56 | 2,684 | Lincoln County | 34.3 | Healthy | Employment & Wages |
| 57 | 2,705 | Morrison County | 33.9 | Healthy | Employment & Wages |
| 58 | 2,780 | Anoka County | 32.5 | Healthy | Housing Cost Burden |
| 59 | 2,808 | Dodge County | 31.8 | Healthy | Employment & Wages |
| 60 | 2,809 | Meeker County | 31.8 | Healthy | Employment & Wages |
| 61 | 2,811 | Nicollet County | 31.8 | Healthy | Employment & Wages |
| 62 | 2,820 | Wilkin County | 31.6 | Healthy | Employment & Wages |
| 63 | 2,823 | Hennepin County | 31.6 | Healthy | Housing Cost Burden |
| 64 | 2,834 | Lac qui Parle County | 31.5 | Healthy | Employment & Wages |
| 65 | 2,845 | Red Lake County | 31.2 | Healthy | Employment & Wages |
| 66 | 2,848 | Yellow Medicine County | 31.1 | Healthy | Employment & Wages |
| 67 | 2,851 | Sherburne County | 31.1 | Healthy | Employment & Wages |
| 68 | 2,854 | Brown County | 30.9 | Healthy | Employment & Wages |
| 69 | 2,872 | Dakota County | 30.5 | Healthy | Housing Cost Burden |
| 70 | 2,875 | Sibley County | 30.2 | Healthy | Employment & Wages |
| 71 | 2,889 | Houston County | 29.9 | Healthy | Employment & Wages |
| 72 | 2,890 | Jackson County | 29.9 | Healthy | Employment & Wages |
| 73 | 2,899 | Wright County | 29.7 | Healthy | Employment & Wages |
| 74 | 2,926 | Goodhue County | 28.9 | Healthy | Employment & Wages |
| 75 | 2,932 | Steele County | 28.7 | Healthy | Housing Cost Burden |
| 76 | 2,939 | Murray County | 28.5 | Healthy | Employment & Wages |
| 77 | 2,956 | Wabasha County | 28.0 | Healthy | Employment & Wages |
| 78 | 2,961 | Roseau County | 27.8 | Healthy | Employment & Wages |
| 79 | 2,970 | Washington County | 27.5 | Healthy | Housing Cost Burden |
| 80 | 2,999 | Scott County | 26.5 | Healthy | Employment & Wages |
| 81 | 3,019 | Stevens County | 25.9 | Healthy | Employment & Wages |
| 82 | 3,020 | Douglas County | 25.9 | Healthy | Housing Cost Burden |
| 83 | 3,022 | Olmsted County | 25.8 | Healthy | Housing Cost Burden |
| 84 | 3,026 | Marshall County | 25.7 | Healthy | Employment & Wages |
| 85 | 3,038 | Rock County | 24.8 | Healthy | Housing Cost Burden |
| 86 | 3,084 | Carver County | 22.3 | Healthy | Employment & Wages |
| 87 | 3,085 | Kittson County | 22.2 | Healthy | Employment & Wages |
1 of 87 county reports for Minnesota are currently available. All 87 counties are scored and visible on the map above. New county reports are published weekly.
How County Scores Work
Each county is scored 0–100 using percentile-rank averaging across five data domains: Debt & Delinquency, Income & Poverty, Housing Cost Burden, Employment & Wages, and Community Vulnerability. A score of 50 means the county falls at the national median. Higher scores indicate greater financial distress.