Maryland County Distress Index
Financial distress scores for all 24 counties in Maryland, scored 0–100 across five domains. Mean score: 45.9. 2counties are in Serious Stress or Crisis.
Data: Census, BLS, Urban Institute, HUD, US Courts | Scores as of 2026-03-17
Maryland Snapshot
Maryland County Map
Loading interactive map…
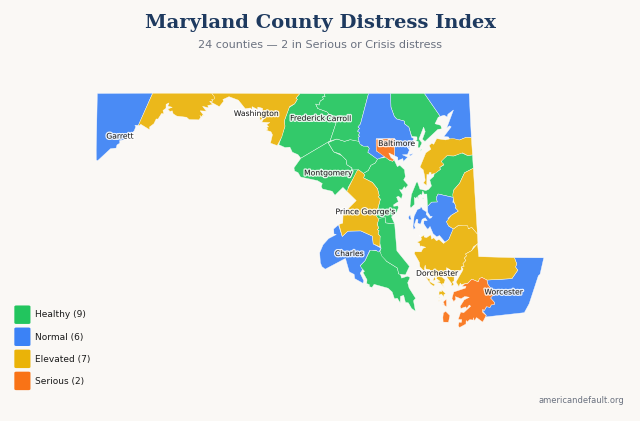
All 24 Maryland counties colored by distress zone. Hover for details; click released counties for full reports.
Most & Least Distressed
Most Distressed
Least Distressed
Score Distribution
How Maryland's 24 county scores are distributed across the 0–100 scale.
All Maryland Counties
24 counties ranked by distress score. Click column headers to sort.
| State Rank | Nat'l Rank | County | Score | Zone | Primary Driver |
|---|---|---|---|---|---|
| 1 | 148 | Baltimore city | 71.5 | Serious Stress | Housing Cost Burden |
| 2 | 474 | Somerset County | 65.5 | Serious Stress | Income & Poverty |
| 3 | 636 | Dorchester County | 62.7 | Elevated | Income & Poverty |
| 4 | 643 | Allegany County | 62.6 | Elevated | Income & Poverty |
| 5 | 882 | Wicomico County | 59.3 | Elevated | Housing Cost Burden |
| 6 | 891 | Caroline County | 59.2 | Elevated | Housing Cost Burden |
| 7 | 979 | Prince George's County | 58.1 | Elevated | Housing Cost Burden |
| 8 | 1,333 | Washington County | 53.5 | Elevated | Housing Cost Burden |
| 9 | 1,568 | Kent County | 50.4 | Elevated | Housing Cost Burden |
| 10 | 1,700 | Baltimore County | 48.6 | Normal | Housing Cost Burden |
| 11 | 1,711 | Cecil County | 48.4 | Normal | Housing Cost Burden |
| 12 | 1,765 | Worcester County | 47.8 | Normal | Employment & Wages |
| 13 | 2,074 | Talbot County | 44.0 | Normal | Housing Cost Burden |
| 14 | 2,166 | Charles County | 42.6 | Normal | Debt & Delinquency |
| 15 | 2,321 | Garrett County | 40.5 | Normal | Income & Poverty |
| 16 | 2,656 | Montgomery County | 34.8 | Healthy | Housing Cost Burden |
| 17 | 2,680 | Harford County | 34.4 | Healthy | Housing Cost Burden |
| 18 | 2,727 | St. Mary's County | 33.5 | Healthy | Housing Cost Burden |
| 19 | 2,762 | Frederick County | 32.9 | Healthy | Housing Cost Burden |
| 20 | 2,776 | Calvert County | 32.6 | Healthy | Housing Cost Burden |
| 21 | 2,815 | Queen Anne's County | 31.7 | Healthy | Housing Cost Burden |
| 22 | 2,846 | Anne Arundel County | 31.2 | Healthy | Housing Cost Burden |
| 23 | 2,886 | Carroll County | 30.0 | Healthy | Employment & Wages |
| 24 | 3,010 | Howard County | 26.1 | Healthy | Housing Cost Burden |
1 of 24 county reports for Maryland are currently available. All 24 counties are scored and visible on the map above. New county reports are published weekly.
How County Scores Work
Each county is scored 0–100 using percentile-rank averaging across five data domains: Debt & Delinquency, Income & Poverty, Housing Cost Burden, Employment & Wages, and Community Vulnerability. A score of 50 means the county falls at the national median. Higher scores indicate greater financial distress.