Kentucky County Distress Index
Financial distress scores for all 120 counties in Kentucky, scored 0–100 across five domains. Mean score: 54.4. 25counties are in Serious Stress or Crisis.
Data: Census, BLS, Urban Institute, HUD, US Courts | Scores as of 2026-03-17
Kentucky Snapshot
Kentucky County Map
Loading interactive map…
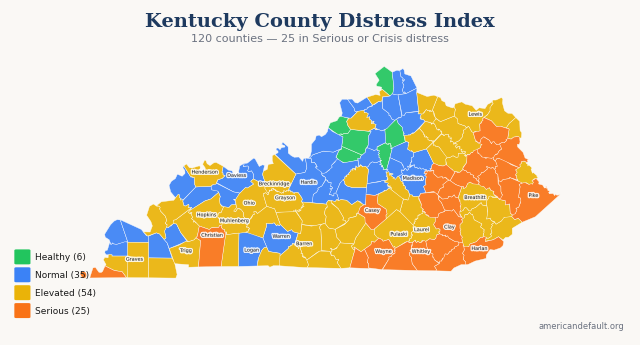
All 120 Kentucky counties colored by distress zone. Hover for details; click released counties for full reports.
Most & Least Distressed
Most Distressed
Least Distressed
Score Distribution
How Kentucky's 120 county scores are distributed across the 0–100 scale.
All Kentucky Counties
120 counties ranked by distress score. Click column headers to sort.
| State Rank | Nat'l Rank | County | Score | Zone | Primary Driver |
|---|---|---|---|---|---|
| 1 | 19 | Bell County | 77.8 | Serious Stress | Income & Poverty |
| 2 | 105 | McCreary County | 72.9 | Serious Stress | Income & Poverty |
| 3 | 111 | Fulton County | 72.6 | Serious Stress | Income & Poverty |
| 4 | 124 | Wayne County | 72.2 | Serious Stress | Income & Poverty |
| 5 | 143 | Knox County | 71.5 | Serious Stress | Income & Poverty |
| 6 | 180 | Lee County | 70.7 | Serious Stress | Income & Poverty |
| 7 | 212 | Christian County | 70.0 | Serious Stress | Housing Cost Burden |
| 8 | 246 | Harlan County | 69.3 | Serious Stress | Income & Poverty |
| 9 | 252 | Wolfe County | 69.1 | Serious Stress | Income & Poverty |
| 10 | 255 | Johnson County | 69.1 | Serious Stress | Income & Poverty |
| 11 | 257 | Jackson County | 69.0 | Serious Stress | Income & Poverty |
| 12 | 304 | Casey County | 68.1 | Serious Stress | Income & Poverty |
| 13 | 312 | Lawrence County | 68.0 | Serious Stress | Income & Poverty |
| 14 | 326 | Whitley County | 67.7 | Serious Stress | Income & Poverty |
| 15 | 351 | Magoffin County | 67.4 | Serious Stress | Income & Poverty |
| 16 | 354 | Clinton County | 67.3 | Serious Stress | Income & Poverty |
| 17 | 358 | Carter County | 67.3 | Serious Stress | Debt & Delinquency |
| 18 | 366 | Owsley County | 67.2 | Serious Stress | Income & Poverty |
| 19 | 368 | Powell County | 67.2 | Serious Stress | Income & Poverty |
| 20 | 376 | Estill County | 67.0 | Serious Stress | Income & Poverty |
| 21 | 381 | Clay County | 67.0 | Serious Stress | Income & Poverty |
| 22 | 392 | Pike County | 66.8 | Serious Stress | Income & Poverty |
| 23 | 412 | Floyd County | 66.5 | Serious Stress | Income & Poverty |
| 24 | 463 | Morgan County | 65.7 | Serious Stress | Income & Poverty |
| 25 | 485 | Elliott County | 65.2 | Serious Stress | Income & Poverty |
| 26 | 554 | Knott County | 64.1 | Elevated | Income & Poverty |
| 27 | 558 | Martin County | 64.0 | Elevated | Income & Poverty |
| 28 | 622 | Adair County | 63.0 | Elevated | Income & Poverty |
| 29 | 669 | Rockcastle County | 62.3 | Elevated | Income & Poverty |
| 30 | 680 | Breathitt County | 62.1 | Elevated | Income & Poverty |
| 31 | 687 | Menifee County | 62.0 | Elevated | Income & Poverty |
| 32 | 699 | Perry County | 61.8 | Elevated | Income & Poverty |
| 33 | 728 | Barren County | 61.4 | Elevated | Income & Poverty |
| 34 | 771 | Russell County | 60.8 | Elevated | Income & Poverty |
| 35 | 772 | Trigg County | 60.8 | Elevated | Community Vulnerability |
| 36 | 775 | Laurel County | 60.8 | Elevated | Income & Poverty |
| 37 | 778 | Cumberland County | 60.8 | Elevated | Income & Poverty |
| 38 | 796 | Letcher County | 60.5 | Elevated | Income & Poverty |
| 39 | 833 | Lewis County | 59.9 | Elevated | Income & Poverty |
| 40 | 836 | Rowan County | 59.9 | Elevated | Income & Poverty |
| 41 | 847 | Leslie County | 59.7 | Elevated | Income & Poverty |
| 42 | 848 | Metcalfe County | 59.7 | Elevated | Income & Poverty |
| 43 | 895 | Boyd County | 59.1 | Elevated | Debt & Delinquency |
| 44 | 955 | Calloway County | 58.4 | Elevated | Income & Poverty |
| 45 | 963 | Edmonson County | 58.3 | Elevated | Employment & Wages |
| 46 | 966 | Allen County | 58.3 | Elevated | Debt & Delinquency |
| 47 | 972 | Mason County | 58.2 | Elevated | Debt & Delinquency |
| 48 | 1,010 | Monroe County | 57.8 | Elevated | Income & Poverty |
| 49 | 1,019 | Green County | 57.7 | Elevated | Income & Poverty |
| 50 | 1,042 | Nicholas County | 57.5 | Elevated | Income & Poverty |
| 51 | 1,052 | Pulaski County | 57.4 | Elevated | Income & Poverty |
| 52 | 1,053 | Fleming County | 57.3 | Elevated | Income & Poverty |
| 53 | 1,062 | Crittenden County | 57.3 | Elevated | Community Vulnerability |
| 54 | 1,064 | Bath County | 57.2 | Elevated | Income & Poverty |
| 55 | 1,098 | Henry County | 56.6 | Elevated | Housing Cost Burden |
| 56 | 1,100 | Hart County | 56.6 | Elevated | Community Vulnerability |
| 57 | 1,110 | Butler County | 56.5 | Elevated | Community Vulnerability |
| 58 | 1,143 | Montgomery County | 56.0 | Elevated | Debt & Delinquency |
| 59 | 1,146 | Caldwell County | 56.0 | Elevated | Community Vulnerability |
| 60 | 1,166 | Greenup County | 55.7 | Elevated | Debt & Delinquency |
| 61 | 1,179 | Grayson County | 55.5 | Elevated | Income & Poverty |
| 62 | 1,199 | Muhlenberg County | 55.1 | Elevated | Income & Poverty |
| 63 | 1,213 | Graves County | 55.0 | Elevated | Income & Poverty |
| 64 | 1,216 | Gallatin County | 54.9 | Elevated | Debt & Delinquency |
| 65 | 1,238 | Robertson County | 54.6 | Elevated | Employment & Wages |
| 66 | 1,240 | Simpson County | 54.6 | Elevated | Debt & Delinquency |
| 67 | 1,294 | Lincoln County | 54.0 | Elevated | Income & Poverty |
| 68 | 1,296 | Taylor County | 53.9 | Elevated | Income & Poverty |
| 69 | 1,334 | Bracken County | 53.5 | Elevated | Employment & Wages |
| 70 | 1,368 | Hickman County | 53.1 | Elevated | Income & Poverty |
| 71 | 1,395 | Bourbon County | 52.7 | Elevated | Debt & Delinquency |
| 72 | 1,472 | Livingston County | 51.6 | Elevated | Debt & Delinquency |
| 73 | 1,481 | Todd County | 51.5 | Elevated | Community Vulnerability |
| 74 | 1,510 | Ohio County | 51.0 | Elevated | Employment & Wages |
| 75 | 1,511 | Washington County | 51.0 | Elevated | Community Vulnerability |
| 76 | 1,514 | Hopkins County | 51.0 | Elevated | Debt & Delinquency |
| 77 | 1,522 | Breckinridge County | 50.9 | Elevated | Community Vulnerability |
| 78 | 1,536 | Henderson County | 50.8 | Elevated | Housing Cost Burden |
| 79 | 1,574 | Garrard County | 50.3 | Elevated | Community Vulnerability |
| 80 | 1,641 | Pendleton County | 49.3 | Normal | Employment & Wages |
| 81 | 1,651 | Carroll County | 49.3 | Normal | Debt & Delinquency |
| 82 | 1,666 | Owen County | 49.0 | Normal | Debt & Delinquency |
| 83 | 1,686 | McLean County | 48.8 | Normal | Employment & Wages |
| 84 | 1,692 | Boyle County | 48.8 | Normal | Debt & Delinquency |
| 85 | 1,702 | Warren County | 48.6 | Normal | Housing Cost Burden |
| 86 | 1,705 | Marion County | 48.5 | Normal | Debt & Delinquency |
| 87 | 1,720 | Daviess County | 48.4 | Normal | Housing Cost Burden |
| 88 | 1,747 | Logan County | 48.0 | Normal | Debt & Delinquency |
| 89 | 1,749 | Grant County | 48.0 | Normal | Debt & Delinquency |
| 90 | 1,768 | Jefferson County | 47.7 | Normal | Housing Cost Burden |
| 91 | 1,775 | McCracken County | 47.7 | Normal | Debt & Delinquency |
| 92 | 1,781 | Hardin County | 47.6 | Normal | Debt & Delinquency |
| 93 | 1,841 | Lyon County | 46.9 | Normal | Community Vulnerability |
| 94 | 1,842 | Larue County | 46.8 | Normal | Debt & Delinquency |
| 95 | 1,848 | Union County | 46.7 | Normal | Debt & Delinquency |
| 96 | 1,886 | Marshall County | 46.2 | Normal | Community Vulnerability |
| 97 | 1,920 | Harrison County | 45.7 | Normal | Debt & Delinquency |
| 98 | 1,926 | Fayette County | 45.6 | Normal | Housing Cost Burden |
| 99 | 1,937 | Clark County | 45.5 | Normal | Debt & Delinquency |
| 100 | 1,940 | Webster County | 45.5 | Normal | Community Vulnerability |
| 101 | 1,981 | Carlisle County | 45.0 | Normal | Debt & Delinquency |
| 102 | 2,140 | Madison County | 43.1 | Normal | Debt & Delinquency |
| 103 | 2,158 | Franklin County | 42.7 | Normal | Housing Cost Burden |
| 104 | 2,277 | Anderson County | 41.2 | Normal | Debt & Delinquency |
| 105 | 2,278 | Meade County | 41.2 | Normal | Debt & Delinquency |
| 106 | 2,337 | Mercer County | 40.2 | Normal | Debt & Delinquency |
| 107 | 2,436 | Jessamine County | 38.6 | Normal | Housing Cost Burden |
| 108 | 2,501 | Nelson County | 37.7 | Normal | Debt & Delinquency |
| 109 | 2,509 | Campbell County | 37.6 | Normal | Housing Cost Burden |
| 110 | 2,516 | Kenton County | 37.4 | Normal | Housing Cost Burden |
| 111 | 2,527 | Trimble County | 37.2 | Normal | Debt & Delinquency |
| 112 | 2,549 | Hancock County | 36.8 | Normal | Community Vulnerability |
| 113 | 2,580 | Ballard County | 36.2 | Normal | Debt & Delinquency |
| 114 | 2,585 | Bullitt County | 36.1 | Normal | Employment & Wages |
| 115 | 2,735 | Scott County | 33.4 | Healthy | Debt & Delinquency |
| 116 | 2,761 | Spencer County | 32.9 | Healthy | Employment & Wages |
| 117 | 2,783 | Shelby County | 32.4 | Healthy | Debt & Delinquency |
| 118 | 2,789 | Boone County | 32.2 | Healthy | Debt & Delinquency |
| 119 | 2,909 | Woodford County | 29.3 | Healthy | Housing Cost Burden |
| 120 | 3,142 | Oldham County | 15.1 | Healthy | Housing Cost Burden |
1 of 120 county reports for Kentucky are currently available. All 120 counties are scored and visible on the map above. New county reports are published weekly.
How County Scores Work
Each county is scored 0–100 using percentile-rank averaging across five data domains: Debt & Delinquency, Income & Poverty, Housing Cost Burden, Employment & Wages, and Community Vulnerability. A score of 50 means the county falls at the national median. Higher scores indicate greater financial distress.