Indiana County Distress Index
Financial distress scores for all 92 counties in Indiana, scored 0–100 across five domains. Mean score: 43.9.
Data: Census, BLS, Urban Institute, HUD, US Courts | Scores as of 2026-03-17
Indiana Snapshot
Indiana County Map
Loading interactive map…
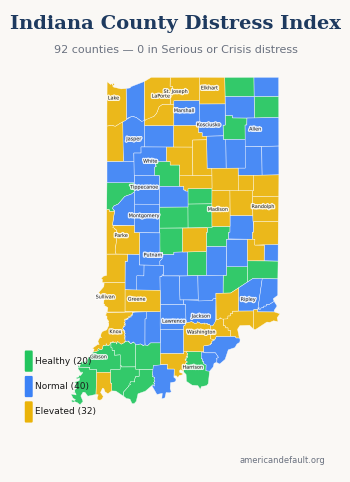
All 92 Indiana counties colored by distress zone. Hover for details; click released counties for full reports.
Most & Least Distressed
Most Distressed
Least Distressed
Score Distribution
How Indiana's 92 county scores are distributed across the 0–100 scale.
All Indiana Counties
92 counties ranked by distress score. Click column headers to sort.
| State Rank | Nat'l Rank | County | Score | Zone | Primary Driver |
|---|---|---|---|---|---|
| 1 | 513 | Delaware County | 64.8 | Elevated | Income & Poverty |
| 2 | 547 | Vigo County | 64.2 | Elevated | Income & Poverty |
| 3 | 569 | Wayne County | 63.9 | Elevated | Income & Poverty |
| 4 | 605 | Grant County | 63.3 | Elevated | Income & Poverty |
| 5 | 639 | Fayette County | 62.7 | Elevated | Debt & Delinquency |
| 6 | 880 | Madison County | 59.3 | Elevated | Housing Cost Burden |
| 7 | 884 | Blackford County | 59.3 | Elevated | Income & Poverty |
| 8 | 902 | Switzerland County | 59.1 | Elevated | Community Vulnerability |
| 9 | 1,014 | Crawford County | 57.7 | Elevated | Income & Poverty |
| 10 | 1,034 | Howard County | 57.5 | Elevated | Debt & Delinquency |
| 11 | 1,060 | Marion County | 57.3 | Elevated | Housing Cost Burden |
| 12 | 1,067 | Washington County | 57.2 | Elevated | Debt & Delinquency |
| 13 | 1,153 | Scott County | 55.8 | Elevated | Debt & Delinquency |
| 14 | 1,246 | Miami County | 54.5 | Elevated | Debt & Delinquency |
| 15 | 1,256 | Lake County | 54.4 | Elevated | Housing Cost Burden |
| 16 | 1,262 | Starke County | 54.3 | Elevated | Debt & Delinquency |
| 17 | 1,281 | Jay County | 54.1 | Elevated | Debt & Delinquency |
| 18 | 1,290 | Vanderburgh County | 54.0 | Elevated | Housing Cost Burden |
| 19 | 1,297 | Jennings County | 53.9 | Elevated | Debt & Delinquency |
| 20 | 1,350 | Knox County | 53.3 | Elevated | Income & Poverty |
| 21 | 1,403 | Sullivan County | 52.7 | Elevated | Income & Poverty |
| 22 | 1,404 | LaPorte County | 52.6 | Elevated | Debt & Delinquency |
| 23 | 1,439 | Parke County | 52.2 | Elevated | Community Vulnerability |
| 24 | 1,440 | Randolph County | 52.2 | Elevated | Income & Poverty |
| 25 | 1,457 | Cass County | 51.9 | Elevated | Debt & Delinquency |
| 26 | 1,476 | St. Joseph County | 51.5 | Elevated | Housing Cost Burden |
| 27 | 1,499 | Newton County | 51.1 | Elevated | Employment & Wages |
| 28 | 1,513 | Jefferson County | 51.0 | Elevated | Community Vulnerability |
| 29 | 1,518 | Vermillion County | 50.9 | Elevated | Debt & Delinquency |
| 30 | 1,533 | Greene County | 50.8 | Elevated | Community Vulnerability |
| 31 | 1,535 | Fulton County | 50.8 | Elevated | Debt & Delinquency |
| 32 | 1,592 | Elkhart County | 50.1 | Elevated | Debt & Delinquency |
| 33 | 1,600 | Ohio County | 50.0 | Normal | Debt & Delinquency |
| 34 | 1,633 | Henry County | 49.5 | Normal | Community Vulnerability |
| 35 | 1,647 | Benton County | 49.3 | Normal | Debt & Delinquency |
| 36 | 1,748 | Orange County | 48.0 | Normal | Income & Poverty |
| 37 | 1,786 | Tippecanoe County | 47.6 | Normal | Housing Cost Burden |
| 38 | 1,817 | Shelby County | 47.1 | Normal | Debt & Delinquency |
| 39 | 1,875 | Owen County | 46.3 | Normal | Community Vulnerability |
| 40 | 1,887 | Brown County | 46.1 | Normal | Housing Cost Burden |
| 41 | 1,902 | Monroe County | 46.0 | Normal | Housing Cost Burden |
| 42 | 1,984 | Clay County | 45.0 | Normal | Debt & Delinquency |
| 43 | 1,985 | White County | 45.0 | Normal | Debt & Delinquency |
| 44 | 2,036 | Lawrence County | 44.5 | Normal | Debt & Delinquency |
| 45 | 2,087 | Clark County | 43.9 | Normal | Debt & Delinquency |
| 46 | 2,099 | Allen County | 43.8 | Normal | Housing Cost Burden |
| 47 | 2,108 | Montgomery County | 43.7 | Normal | Debt & Delinquency |
| 48 | 2,134 | Morgan County | 43.2 | Normal | Debt & Delinquency |
| 49 | 2,135 | Rush County | 43.2 | Normal | Debt & Delinquency |
| 50 | 2,165 | Wabash County | 42.6 | Normal | Debt & Delinquency |
| 51 | 2,175 | Noble County | 42.5 | Normal | Debt & Delinquency |
| 52 | 2,180 | Adams County | 42.5 | Normal | Community Vulnerability |
| 53 | 2,185 | Perry County | 42.4 | Normal | Income & Poverty |
| 54 | 2,258 | Martin County | 41.4 | Normal | Income & Poverty |
| 55 | 2,329 | Kosciusko County | 40.3 | Normal | Community Vulnerability |
| 56 | 2,343 | Pulaski County | 40.1 | Normal | Community Vulnerability |
| 57 | 2,348 | Fountain County | 40.0 | Normal | Community Vulnerability |
| 58 | 2,407 | Daviess County | 39.0 | Normal | Community Vulnerability |
| 59 | 2,421 | Jackson County | 38.7 | Normal | Debt & Delinquency |
| 60 | 2,445 | Huntington County | 38.5 | Normal | Debt & Delinquency |
| 61 | 2,452 | Floyd County | 38.3 | Normal | Housing Cost Burden |
| 62 | 2,453 | Clinton County | 38.3 | Normal | Debt & Delinquency |
| 63 | 2,477 | Union County | 38.0 | Normal | Employment & Wages |
| 64 | 2,478 | Jasper County | 38.0 | Normal | Employment & Wages |
| 65 | 2,511 | Ripley County | 37.5 | Normal | Housing Cost Burden |
| 66 | 2,537 | Bartholomew County | 37.0 | Normal | Housing Cost Burden |
| 67 | 2,551 | Marshall County | 36.8 | Normal | Community Vulnerability |
| 68 | 2,556 | Porter County | 36.6 | Normal | Housing Cost Burden |
| 69 | 2,569 | Putnam County | 36.4 | Normal | Debt & Delinquency |
| 70 | 2,609 | Steuben County | 35.7 | Normal | Debt & Delinquency |
| 71 | 2,624 | Wells County | 35.5 | Normal | Debt & Delinquency |
| 72 | 2,636 | Dearborn County | 35.3 | Normal | Employment & Wages |
| 73 | 2,666 | Carroll County | 34.7 | Healthy | Debt & Delinquency |
| 74 | 2,673 | Pike County | 34.6 | Healthy | Debt & Delinquency |
| 75 | 2,677 | Harrison County | 34.5 | Healthy | Employment & Wages |
| 76 | 2,734 | Decatur County | 33.4 | Healthy | Debt & Delinquency |
| 77 | 2,744 | Warren County | 33.2 | Healthy | Debt & Delinquency |
| 78 | 2,752 | DeKalb County | 33.1 | Healthy | Debt & Delinquency |
| 79 | 2,770 | Johnson County | 32.7 | Healthy | Debt & Delinquency |
| 80 | 2,791 | Franklin County | 32.2 | Healthy | Employment & Wages |
| 81 | 2,794 | Tipton County | 32.1 | Healthy | Debt & Delinquency |
| 82 | 2,832 | Whitley County | 31.5 | Healthy | Debt & Delinquency |
| 83 | 2,844 | Gibson County | 31.2 | Healthy | Debt & Delinquency |
| 84 | 2,918 | Hendricks County | 29.1 | Healthy | Debt & Delinquency |
| 85 | 2,921 | LaGrange County | 29.0 | Healthy | Community Vulnerability |
| 86 | 2,930 | Hancock County | 28.8 | Healthy | Debt & Delinquency |
| 87 | 2,992 | Posey County | 26.7 | Healthy | Employment & Wages |
| 88 | 3,024 | Spencer County | 25.8 | Healthy | Employment & Wages |
| 89 | 3,074 | Dubois County | 22.8 | Healthy | Employment & Wages |
| 90 | 3,103 | Boone County | 21.0 | Healthy | Employment & Wages |
| 91 | 3,106 | Warrick County | 20.9 | Healthy | Debt & Delinquency |
| 92 | 3,138 | Hamilton County | 16.6 | Healthy | Housing Cost Burden |
0 of 92 county reports for Indiana are currently available. All 92 counties are scored and visible on the map above. New county reports are published weekly.
How County Scores Work
Each county is scored 0–100 using percentile-rank averaging across five data domains: Debt & Delinquency, Income & Poverty, Housing Cost Burden, Employment & Wages, and Community Vulnerability. A score of 50 means the county falls at the national median. Higher scores indicate greater financial distress.