Connecticut County Distress Index
Financial distress scores for all 9 counties in Connecticut, scored 0–100 across five domains. Mean score: 44.8.
Data: Census, BLS, Urban Institute, HUD, US Courts | Scores as of 2026-03-17
Connecticut Snapshot
Connecticut County Map
Loading interactive map…
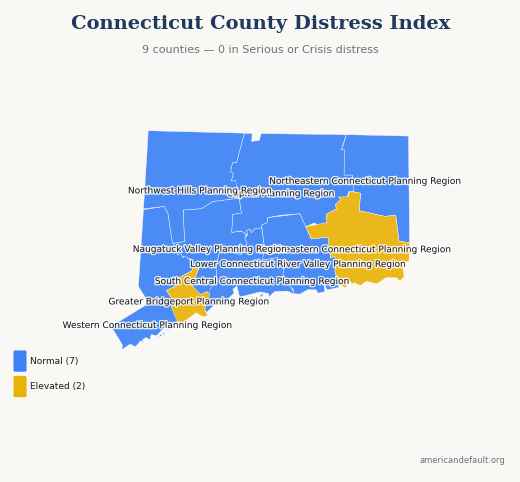
All 9 Connecticut counties colored by distress zone. Hover for details; click released counties for full reports.
Most & Least Distressed
Most Distressed
Least Distressed
Score Distribution
How Connecticut's 9 county scores are distributed across the 0–100 scale.
All Connecticut Counties
9 counties ranked by distress score. Click column headers to sort.
| State Rank | Nat'l Rank | County | Score | Zone | Primary Driver |
|---|---|---|---|---|---|
| 1 | 1,169 | Greater Bridgeport Planning Region | 55.6 | Elevated | Housing Cost Burden |
| 2 | 1,344 | Southeastern Connecticut Planning Region | 53.4 | Elevated | Housing Cost Burden |
| 3 | 1,708 | Naugatuck Valley Planning Region | 48.5 | Normal | Housing Cost Burden |
| 4 | 1,826 | Northeastern Connecticut Planning Region | 47.0 | Normal | Employment & Wages |
| 5 | 1,846 | South Central Connecticut Planning Region | 46.7 | Normal | Housing Cost Burden |
| 6 | 2,225 | Capitol Planning Region | 41.8 | Normal | Housing Cost Burden |
| 7 | 2,385 | Northwest Hills Planning Region | 39.4 | Normal | Housing Cost Burden |
| 8 | 2,621 | Lower Connecticut River Valley Planning Region | 35.6 | Normal | Housing Cost Burden |
| 9 | 2,630 | Western Connecticut Planning Region | 35.4 | Normal | Housing Cost Burden |
0 of 9 county reports for Connecticut are currently available. All 9 counties are scored and visible on the map above. New county reports are published weekly.
How County Scores Work
Each county is scored 0–100 using percentile-rank averaging across five data domains: Debt & Delinquency, Income & Poverty, Housing Cost Burden, Employment & Wages, and Community Vulnerability. A score of 50 means the county falls at the national median. Higher scores indicate greater financial distress.