Wisconsin County Distress Index
Financial distress scores for all 72 counties in Wisconsin, scored 0–100 across five domains. Mean score: 37.5. 1county is in Serious Stress or Crisis.
Data: Census, BLS, Urban Institute, HUD, US Courts | Scores as of 2026-03-17
Wisconsin Snapshot
Wisconsin County Map
Loading interactive map…
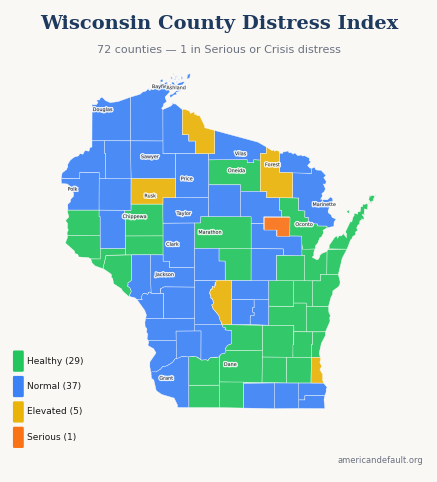
All 72 Wisconsin counties colored by distress zone. Hover for details; click released counties for full reports.
Most & Least Distressed
Most Distressed
Least Distressed
Score Distribution
How Wisconsin's 72 county scores are distributed across the 0–100 scale.
All Wisconsin Counties
72 counties ranked by distress score. Click column headers to sort.
| State Rank | Nat'l Rank | County | Score | Zone | Primary Driver |
|---|---|---|---|---|---|
| 1 | 240 | Menominee County | 69.4 | Serious Stress | Income & Poverty |
| 2 | 976 | Milwaukee County | 58.2 | Elevated | Housing Cost Burden |
| 3 | 1,347 | Adams County | 53.3 | Elevated | Income & Poverty |
| 4 | 1,454 | Rusk County | 52.0 | Elevated | Income & Poverty |
| 5 | 1,530 | Forest County | 50.8 | Elevated | Income & Poverty |
| 6 | 1,542 | Iron County | 50.6 | Elevated | Employment & Wages |
| 7 | 1,627 | Ashland County | 49.5 | Normal | Income & Poverty |
| 8 | 1,660 | Burnett County | 49.2 | Normal | Employment & Wages |
| 9 | 1,726 | Kenosha County | 48.3 | Normal | Housing Cost Burden |
| 10 | 1,767 | Jackson County | 47.7 | Normal | Employment & Wages |
| 11 | 1,810 | Sawyer County | 47.3 | Normal | Income & Poverty |
| 12 | 1,922 | Marquette County | 45.7 | Normal | Employment & Wages |
| 13 | 2,021 | Price County | 44.7 | Normal | Income & Poverty |
| 14 | 2,051 | Racine County | 44.3 | Normal | Housing Cost Burden |
| 15 | 2,054 | Langlade County | 44.3 | Normal | Income & Poverty |
| 16 | 2,071 | Waushara County | 44.0 | Normal | Employment & Wages |
| 17 | 2,082 | Washburn County | 43.9 | Normal | Employment & Wages |
| 18 | 2,106 | Rock County | 43.7 | Normal | Housing Cost Burden |
| 19 | 2,110 | Crawford County | 43.6 | Normal | Employment & Wages |
| 20 | 2,115 | Monroe County | 43.6 | Normal | Income & Poverty |
| 21 | 2,132 | Juneau County | 43.2 | Normal | Income & Poverty |
| 22 | 2,144 | Green Lake County | 43.1 | Normal | Community Vulnerability |
| 23 | 2,196 | Bayfield County | 42.2 | Normal | Employment & Wages |
| 24 | 2,211 | Waupaca County | 42.0 | Normal | Housing Cost Burden |
| 25 | 2,212 | Douglas County | 42.0 | Normal | Employment & Wages |
| 26 | 2,223 | Richland County | 41.9 | Normal | Income & Poverty |
| 27 | 2,319 | Taylor County | 40.5 | Normal | Employment & Wages |
| 28 | 2,375 | Clark County | 39.5 | Normal | Community Vulnerability |
| 29 | 2,397 | Grant County | 39.2 | Normal | Income & Poverty |
| 30 | 2,416 | Florence County | 38.9 | Normal | Employment & Wages |
| 31 | 2,443 | Vernon County | 38.5 | Normal | Income & Poverty |
| 32 | 2,448 | Shawano County | 38.4 | Normal | Employment & Wages |
| 33 | 2,454 | Barron County | 38.3 | Normal | Employment & Wages |
| 34 | 2,490 | Marinette County | 37.8 | Normal | Employment & Wages |
| 35 | 2,523 | Polk County | 37.3 | Normal | Employment & Wages |
| 36 | 2,557 | La Crosse County | 36.6 | Normal | Housing Cost Burden |
| 37 | 2,564 | Trempealeau County | 36.5 | Normal | Employment & Wages |
| 38 | 2,576 | Wood County | 36.3 | Normal | Employment & Wages |
| 39 | 2,591 | Sauk County | 35.9 | Normal | Housing Cost Burden |
| 40 | 2,592 | Dunn County | 35.9 | Normal | Housing Cost Burden |
| 41 | 2,601 | Vilas County | 35.8 | Normal | Income & Poverty |
| 42 | 2,633 | Lincoln County | 35.4 | Normal | Employment & Wages |
| 43 | 2,650 | Walworth County | 35.1 | Normal | Housing Cost Burden |
| 44 | 2,668 | Eau Claire County | 34.7 | Healthy | Housing Cost Burden |
| 45 | 2,700 | Pierce County | 34.0 | Healthy | Employment & Wages |
| 46 | 2,721 | Fond du Lac County | 33.7 | Healthy | Housing Cost Burden |
| 47 | 2,748 | Winnebago County | 33.2 | Healthy | Housing Cost Burden |
| 48 | 2,785 | Marathon County | 32.4 | Healthy | Housing Cost Burden |
| 49 | 2,788 | Buffalo County | 32.3 | Healthy | Employment & Wages |
| 50 | 2,790 | Oneida County | 32.2 | Healthy | Employment & Wages |
| 51 | 2,804 | Pepin County | 31.9 | Healthy | Employment & Wages |
| 52 | 2,806 | Lafayette County | 31.9 | Healthy | Community Vulnerability |
| 53 | 2,814 | Dane County | 31.7 | Healthy | Housing Cost Burden |
| 54 | 2,836 | Jefferson County | 31.4 | Healthy | Housing Cost Burden |
| 55 | 2,841 | Chippewa County | 31.3 | Healthy | Employment & Wages |
| 56 | 2,856 | Oconto County | 30.9 | Healthy | Employment & Wages |
| 57 | 2,882 | Brown County | 30.1 | Healthy | Housing Cost Burden |
| 58 | 2,894 | Door County | 29.8 | Healthy | Employment & Wages |
| 59 | 2,898 | Portage County | 29.7 | Healthy | Employment & Wages |
| 60 | 2,933 | Dodge County | 28.5 | Healthy | Housing Cost Burden |
| 61 | 2,945 | Manitowoc County | 28.3 | Healthy | Employment & Wages |
| 62 | 2,969 | Sheboygan County | 27.5 | Healthy | Housing Cost Burden |
| 63 | 3,007 | Green County | 26.2 | Healthy | Employment & Wages |
| 64 | 3,013 | Kewaunee County | 26.0 | Healthy | Employment & Wages |
| 65 | 3,017 | St. Croix County | 25.9 | Healthy | Employment & Wages |
| 66 | 3,032 | Columbia County | 25.3 | Healthy | Housing Cost Burden |
| 67 | 3,043 | Washington County | 24.6 | Healthy | Employment & Wages |
| 68 | 3,083 | Calumet County | 22.3 | Healthy | Employment & Wages |
| 69 | 3,088 | Outagamie County | 22.0 | Healthy | Housing Cost Burden |
| 70 | 3,095 | Ozaukee County | 21.8 | Healthy | Housing Cost Burden |
| 71 | 3,099 | Waukesha County | 21.3 | Healthy | Housing Cost Burden |
| 72 | 3,107 | Iowa County | 20.8 | Healthy | Housing Cost Burden |
0 of 72 county reports for Wisconsin are currently available. All 72 counties are scored and visible on the map above. New county reports are published weekly.
How County Scores Work
Each county is scored 0–100 using percentile-rank averaging across five data domains: Debt & Delinquency, Income & Poverty, Housing Cost Burden, Employment & Wages, and Community Vulnerability. A score of 50 means the county falls at the national median. Higher scores indicate greater financial distress.