West Virginia County Distress Index
Financial distress scores for all 55 counties in West Virginia, scored 0–100 across five domains. Mean score: 52.8. 5counties are in Serious Stress or Crisis.
Data: Census, BLS, Urban Institute, HUD, US Courts | Scores as of 2026-03-17
West Virginia Snapshot
West Virginia County Map
Loading interactive map…
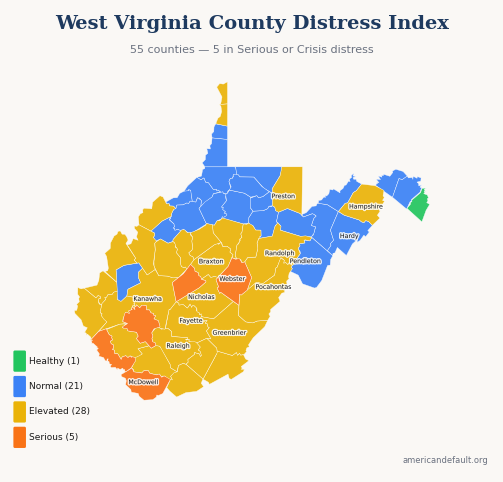
All 55 West Virginia counties colored by distress zone. Hover for details; click released counties for full reports.
Most & Least Distressed
Most Distressed
Least Distressed
Score Distribution
How West Virginia's 55 county scores are distributed across the 0–100 scale.
All West Virginia Counties
55 counties ranked by distress score. Click column headers to sort.
| State Rank | Nat'l Rank | County | Score | Zone | Primary Driver |
|---|---|---|---|---|---|
| 1 | 196 | Webster County | 70.3 | Serious Stress | Income & Poverty |
| 2 | 294 | Mingo County | 68.3 | Serious Stress | Income & Poverty |
| 3 | 305 | Clay County | 68.1 | Serious Stress | Income & Poverty |
| 4 | 313 | McDowell County | 68.0 | Serious Stress | Income & Poverty |
| 5 | 431 | Boone County | 66.2 | Serious Stress | Debt & Delinquency |
| 6 | 507 | Lincoln County | 64.9 | Elevated | Debt & Delinquency |
| 7 | 588 | Fayette County | 63.6 | Elevated | Community Vulnerability |
| 8 | 592 | Cabell County | 63.5 | Elevated | Housing Cost Burden |
| 9 | 653 | Summers County | 62.5 | Elevated | Income & Poverty |
| 10 | 761 | Calhoun County | 60.9 | Elevated | Income & Poverty |
| 11 | 764 | Logan County | 60.9 | Elevated | Income & Poverty |
| 12 | 812 | Wyoming County | 60.3 | Elevated | Income & Poverty |
| 13 | 842 | Mercer County | 59.9 | Elevated | Income & Poverty |
| 14 | 869 | Brooke County | 59.5 | Elevated | Debt & Delinquency |
| 15 | 897 | Randolph County | 59.1 | Elevated | Debt & Delinquency |
| 16 | 919 | Wayne County | 58.8 | Elevated | Income & Poverty |
| 17 | 1,040 | Roane County | 57.5 | Elevated | Income & Poverty |
| 18 | 1,061 | Greenbrier County | 57.3 | Elevated | Income & Poverty |
| 19 | 1,069 | Braxton County | 57.2 | Elevated | Income & Poverty |
| 20 | 1,118 | Nicholas County | 56.4 | Elevated | Income & Poverty |
| 21 | 1,165 | Hancock County | 55.7 | Elevated | Employment & Wages |
| 22 | 1,210 | Raleigh County | 55.0 | Elevated | Income & Poverty |
| 23 | 1,321 | Gilmer County | 53.6 | Elevated | Income & Poverty |
| 24 | 1,330 | Monroe County | 53.6 | Elevated | Income & Poverty |
| 25 | 1,335 | Lewis County | 53.5 | Elevated | Debt & Delinquency |
| 26 | 1,358 | Kanawha County | 53.2 | Elevated | Debt & Delinquency |
| 27 | 1,359 | Upshur County | 53.2 | Elevated | Income & Poverty |
| 28 | 1,367 | Jackson County | 53.1 | Elevated | Employment & Wages |
| 29 | 1,396 | Preston County | 52.7 | Elevated | Income & Poverty |
| 30 | 1,413 | Hampshire County | 52.5 | Elevated | Community Vulnerability |
| 31 | 1,462 | Wood County | 51.8 | Elevated | Debt & Delinquency |
| 32 | 1,559 | Mason County | 50.4 | Elevated | Income & Poverty |
| 33 | 1,582 | Pocahontas County | 50.2 | Elevated | Income & Poverty |
| 34 | 1,613 | Hardy County | 49.7 | Normal | Debt & Delinquency |
| 35 | 1,645 | Marshall County | 49.3 | Normal | Employment & Wages |
| 36 | 1,652 | Wetzel County | 49.3 | Normal | Employment & Wages |
| 37 | 1,682 | Barbour County | 48.9 | Normal | Income & Poverty |
| 38 | 1,710 | Tyler County | 48.5 | Normal | Community Vulnerability |
| 39 | 1,754 | Ritchie County | 47.9 | Normal | Community Vulnerability |
| 40 | 1,798 | Ohio County | 47.5 | Normal | Housing Cost Burden |
| 41 | 1,812 | Grant County | 47.2 | Normal | Income & Poverty |
| 42 | 1,824 | Wirt County | 47.0 | Normal | Employment & Wages |
| 43 | 1,844 | Marion County | 46.8 | Normal | Employment & Wages |
| 44 | 1,934 | Taylor County | 45.6 | Normal | Community Vulnerability |
| 45 | 1,975 | Doddridge County | 45.1 | Normal | Income & Poverty |
| 46 | 2,027 | Berkeley County | 44.6 | Normal | Debt & Delinquency |
| 47 | 2,031 | Pendleton County | 44.6 | Normal | Community Vulnerability |
| 48 | 2,058 | Pleasants County | 44.2 | Normal | Community Vulnerability |
| 49 | 2,181 | Harrison County | 42.4 | Normal | Debt & Delinquency |
| 50 | 2,266 | Tucker County | 41.4 | Normal | Income & Poverty |
| 51 | 2,292 | Monongalia County | 41.0 | Normal | Housing Cost Burden |
| 52 | 2,398 | Mineral County | 39.2 | Normal | Employment & Wages |
| 53 | 2,603 | Morgan County | 35.8 | Normal | Employment & Wages |
| 54 | 2,618 | Putnam County | 35.6 | Normal | Debt & Delinquency |
| 55 | 2,911 | Jefferson County | 29.2 | Healthy | Housing Cost Burden |
0 of 55 county reports for West Virginia are currently available. All 55 counties are scored and visible on the map above. New county reports are published weekly.
How County Scores Work
Each county is scored 0–100 using percentile-rank averaging across five data domains: Debt & Delinquency, Income & Poverty, Housing Cost Burden, Employment & Wages, and Community Vulnerability. A score of 50 means the county falls at the national median. Higher scores indicate greater financial distress.