South Dakota County Distress Index
Financial distress scores for all 66 counties in South Dakota, scored 0–100 across five domains. Mean score: 34.8. 1county is in Serious Stress or Crisis.
Data: Census, BLS, Urban Institute, HUD, US Courts | Scores as of 2026-03-17
South Dakota Snapshot
South Dakota County Map
Loading interactive map…
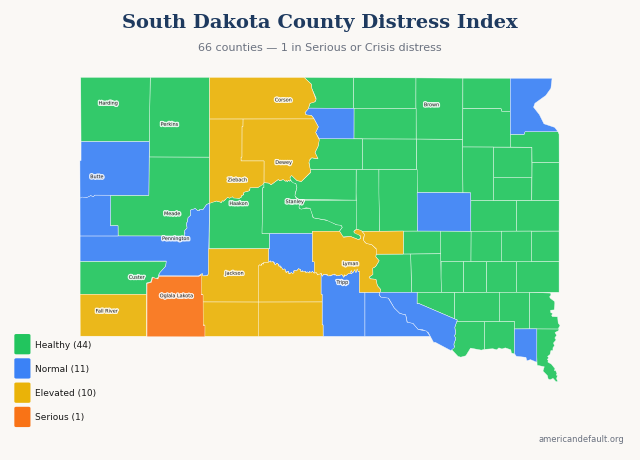
All 66 South Dakota counties colored by distress zone. Hover for details; click released counties for full reports.
Most & Least Distressed
Most Distressed
Least Distressed
Score Distribution
How South Dakota's 66 county scores are distributed across the 0–100 scale.
All South Dakota Counties
66 counties ranked by distress score. Click column headers to sort.
| State Rank | Nat'l Rank | County | Score | Zone | Primary Driver |
|---|---|---|---|---|---|
| 1 | 469 | Oglala Lakota County | 65.6 | Serious Stress | Income & Poverty |
| 2 | 671 | Jackson County | 62.3 | Elevated | Income & Poverty |
| 3 | 693 | Buffalo County | 61.9 | Elevated | Income & Poverty |
| 4 | 758 | Todd County | 61.0 | Elevated | Income & Poverty |
| 5 | 766 | Fall River County | 60.9 | Elevated | Community Vulnerability |
| 6 | 819 | Dewey County | 60.2 | Elevated | Income & Poverty |
| 7 | 826 | Corson County | 60.0 | Elevated | Income & Poverty |
| 8 | 1,203 | Bennett County | 55.1 | Elevated | Income & Poverty |
| 9 | 1,257 | Lyman County | 54.4 | Elevated | Income & Poverty |
| 10 | 1,365 | Ziebach County | 53.1 | Elevated | Income & Poverty |
| 11 | 1,425 | Mellette County | 52.4 | Elevated | Income & Poverty |
| 12 | 1,779 | Roberts County | 47.7 | Normal | Employment & Wages |
| 13 | 1,834 | Walworth County | 46.9 | Normal | Income & Poverty |
| 14 | 1,965 | Beadle County | 45.2 | Normal | Income & Poverty |
| 15 | 2,003 | Charles Mix County | 44.9 | Normal | Income & Poverty |
| 16 | 2,019 | Jones County | 44.7 | Normal | Employment & Wages |
| 17 | 2,070 | Pennington County | 44.1 | Normal | Housing Cost Burden |
| 18 | 2,127 | Butte County | 43.4 | Normal | Housing Cost Burden |
| 19 | 2,156 | Tripp County | 42.8 | Normal | Income & Poverty |
| 20 | 2,275 | Clay County | 41.2 | Normal | Income & Poverty |
| 21 | 2,408 | Gregory County | 39.0 | Normal | Income & Poverty |
| 22 | 2,467 | Lawrence County | 38.2 | Normal | Community Vulnerability |
| 23 | 2,703 | Perkins County | 33.9 | Healthy | Income & Poverty |
| 24 | 2,709 | Miner County | 33.9 | Healthy | Community Vulnerability |
| 25 | 2,720 | Jerauld County | 33.7 | Healthy | Income & Poverty |
| 26 | 2,723 | Custer County | 33.6 | Healthy | Community Vulnerability |
| 27 | 2,756 | Brule County | 33.0 | Healthy | Community Vulnerability |
| 28 | 2,757 | Day County | 33.0 | Healthy | Income & Poverty |
| 29 | 2,784 | Brown County | 32.4 | Healthy | Housing Cost Burden |
| 30 | 2,786 | Potter County | 32.3 | Healthy | Employment & Wages |
| 31 | 2,798 | Meade County | 32.1 | Healthy | Community Vulnerability |
| 32 | 2,805 | Stanley County | 31.9 | Healthy | Housing Cost Burden |
| 33 | 2,807 | Moody County | 31.8 | Healthy | Community Vulnerability |
| 34 | 2,826 | McPherson County | 31.5 | Healthy | Income & Poverty |
| 35 | 2,865 | Sanborn County | 30.6 | Healthy | Income & Poverty |
| 36 | 2,869 | Codington County | 30.5 | Healthy | Housing Cost Burden |
| 37 | 2,883 | Davison County | 30.1 | Healthy | Community Vulnerability |
| 38 | 2,884 | Grant County | 30.1 | Healthy | Community Vulnerability |
| 39 | 2,897 | Minnehaha County | 29.7 | Healthy | Housing Cost Burden |
| 40 | 2,929 | Kingsbury County | 28.9 | Healthy | Employment & Wages |
| 41 | 2,931 | Yankton County | 28.8 | Healthy | Housing Cost Burden |
| 42 | 2,937 | Bon Homme County | 28.5 | Healthy | Employment & Wages |
| 43 | 2,947 | Lake County | 28.3 | Healthy | Housing Cost Burden |
| 44 | 2,986 | McCook County | 26.9 | Healthy | Employment & Wages |
| 45 | 2,991 | Harding County | 26.7 | Healthy | Employment & Wages |
| 46 | 3,006 | Aurora County | 26.3 | Healthy | Income & Poverty |
| 47 | 3,015 | Clark County | 26.0 | Healthy | Income & Poverty |
| 48 | 3,023 | Douglas County | 25.8 | Healthy | Community Vulnerability |
| 49 | 3,028 | Haakon County | 25.6 | Healthy | Community Vulnerability |
| 50 | 3,047 | Turner County | 24.5 | Healthy | Employment & Wages |
| 51 | 3,054 | Faulk County | 24.1 | Healthy | Income & Poverty |
| 52 | 3,063 | Brookings County | 23.6 | Healthy | Housing Cost Burden |
| 53 | 3,065 | Hughes County | 23.5 | Healthy | Housing Cost Burden |
| 54 | 3,076 | Spink County | 22.6 | Healthy | Income & Poverty |
| 55 | 3,079 | Campbell County | 22.5 | Healthy | Income & Poverty |
| 56 | 3,081 | Hutchinson County | 22.3 | Healthy | Employment & Wages |
| 57 | 3,082 | Marshall County | 22.3 | Healthy | Income & Poverty |
| 58 | 3,105 | Deuel County | 21.0 | Healthy | Community Vulnerability |
| 59 | 3,112 | Hyde County | 20.4 | Healthy | Income & Poverty |
| 60 | 3,113 | Hanson County | 20.2 | Healthy | Community Vulnerability |
| 61 | 3,114 | Hand County | 20.1 | Healthy | Employment & Wages |
| 62 | 3,119 | Union County | 19.6 | Healthy | Housing Cost Burden |
| 63 | 3,120 | Sully County | 19.6 | Healthy | Community Vulnerability |
| 64 | 3,132 | Hamlin County | 18.3 | Healthy | Community Vulnerability |
| 65 | 3,140 | Edmunds County | 15.8 | Healthy | Income & Poverty |
| 66 | 3,141 | Lincoln County | 15.2 | Healthy | Housing Cost Burden |
0 of 66 county reports for South Dakota are currently available. All 66 counties are scored and visible on the map above. New county reports are published weekly.
How County Scores Work
Each county is scored 0–100 using percentile-rank averaging across five data domains: Debt & Delinquency, Income & Poverty, Housing Cost Burden, Employment & Wages, and Community Vulnerability. A score of 50 means the county falls at the national median. Higher scores indicate greater financial distress.