North Dakota County Distress Index
Financial distress scores for all 53 counties in North Dakota, scored 0–100 across five domains. Mean score: 29.6.
Data: Census, BLS, Urban Institute, HUD, US Courts | Scores as of 2026-03-17
North Dakota Snapshot
North Dakota County Map
Loading interactive map…
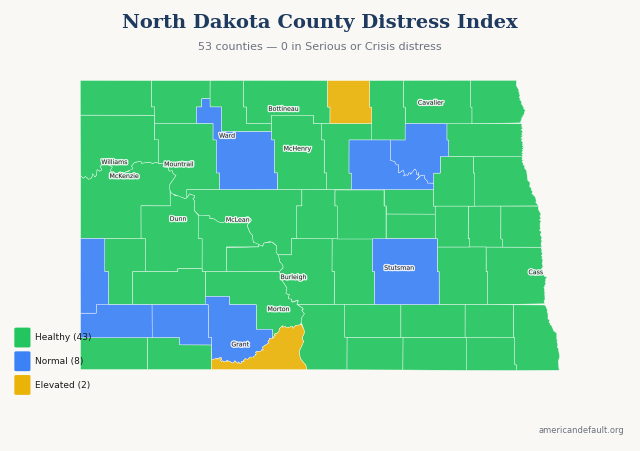
All 53 North Dakota counties colored by distress zone. Hover for details; click released counties for full reports.
Most & Least Distressed
Most Distressed
Least Distressed
Score Distribution
How North Dakota's 53 county scores are distributed across the 0–100 scale.
All North Dakota Counties
53 counties ranked by distress score. Click column headers to sort.
| State Rank | Nat'l Rank | County | Score | Zone | Primary Driver |
|---|---|---|---|---|---|
| 1 | 726 | Rolette County | 61.4 | Elevated | Income & Poverty |
| 2 | 1,149 | Sioux County | 55.9 | Elevated | Income & Poverty |
| 3 | 2,120 | Benson County | 43.5 | Normal | Income & Poverty |
| 4 | 2,282 | Ramsey County | 41.1 | Normal | Community Vulnerability |
| 5 | 2,415 | Grant County | 38.9 | Normal | Income & Poverty |
| 6 | 2,447 | Golden Valley County | 38.4 | Normal | Income & Poverty |
| 7 | 2,525 | Hettinger County | 37.2 | Normal | Income & Poverty |
| 8 | 2,600 | Ward County | 35.8 | Normal | Housing Cost Burden |
| 9 | 2,615 | Stutsman County | 35.7 | Normal | Housing Cost Burden |
| 10 | 2,628 | Slope County | 35.5 | Normal | Income & Poverty |
| 11 | 2,652 | Mountrail County | 35.0 | Healthy | Community Vulnerability |
| 12 | 2,655 | Sheridan County | 34.8 | Healthy | Income & Poverty |
| 13 | 2,676 | Eddy County | 34.5 | Healthy | Employment & Wages |
| 14 | 2,682 | Divide County | 34.4 | Healthy | Employment & Wages |
| 15 | 2,702 | Barnes County | 33.9 | Healthy | Debt & Delinquency |
| 16 | 2,708 | Richland County | 33.9 | Healthy | Housing Cost Burden |
| 17 | 2,711 | Pierce County | 33.8 | Healthy | Income & Poverty |
| 18 | 2,749 | Grand Forks County | 33.2 | Healthy | Housing Cost Burden |
| 19 | 2,750 | Adams County | 33.1 | Healthy | Community Vulnerability |
| 20 | 2,778 | Mercer County | 32.5 | Healthy | Employment & Wages |
| 21 | 2,787 | Emmons County | 32.3 | Healthy | Income & Poverty |
| 22 | 2,792 | Logan County | 32.1 | Healthy | Income & Poverty |
| 23 | 2,828 | Walsh County | 31.5 | Healthy | Employment & Wages |
| 24 | 2,876 | McIntosh County | 30.2 | Healthy | Income & Poverty |
| 25 | 2,905 | Williams County | 29.4 | Healthy | Debt & Delinquency |
| 26 | 2,908 | Wells County | 29.3 | Healthy | Employment & Wages |
| 27 | 2,949 | McKenzie County | 28.3 | Healthy | Debt & Delinquency |
| 28 | 2,950 | Morton County | 28.2 | Healthy | Housing Cost Burden |
| 29 | 2,957 | McHenry County | 28.0 | Healthy | Income & Poverty |
| 30 | 2,962 | Cass County | 27.8 | Healthy | Housing Cost Burden |
| 31 | 2,975 | Kidder County | 27.3 | Healthy | Income & Poverty |
| 32 | 2,994 | Towner County | 26.6 | Healthy | Community Vulnerability |
| 33 | 3,001 | Stark County | 26.5 | Healthy | Housing Cost Burden |
| 34 | 3,008 | Nelson County | 26.2 | Healthy | Community Vulnerability |
| 35 | 3,009 | Dunn County | 26.1 | Healthy | Community Vulnerability |
| 36 | 3,021 | Dickey County | 25.8 | Healthy | Income & Poverty |
| 37 | 3,035 | Foster County | 25.2 | Healthy | Housing Cost Burden |
| 38 | 3,052 | Renville County | 24.2 | Healthy | Employment & Wages |
| 39 | 3,053 | Griggs County | 24.1 | Healthy | Income & Poverty |
| 40 | 3,061 | Burleigh County | 23.7 | Healthy | Housing Cost Burden |
| 41 | 3,096 | Oliver County | 21.7 | Healthy | Employment & Wages |
| 42 | 3,097 | Pembina County | 21.6 | Healthy | Community Vulnerability |
| 43 | 3,098 | Bottineau County | 21.4 | Healthy | Community Vulnerability |
| 44 | 3,108 | Burke County | 20.8 | Healthy | Employment & Wages |
| 45 | 3,111 | Sargent County | 20.5 | Healthy | Employment & Wages |
| 46 | 3,116 | Ransom County | 19.8 | Healthy | Housing Cost Burden |
| 47 | 3,118 | McLean County | 19.6 | Healthy | Employment & Wages |
| 48 | 3,121 | Bowman County | 19.3 | Healthy | Income & Poverty |
| 49 | 3,124 | Traill County | 18.8 | Healthy | Housing Cost Burden |
| 50 | 3,127 | LaMoure County | 18.7 | Healthy | Income & Poverty |
| 51 | 3,134 | Billings County | 17.3 | Healthy | Income & Poverty |
| 52 | 3,135 | Cavalier County | 17.1 | Healthy | Employment & Wages |
| 53 | 3,137 | Steele County | 16.7 | Healthy | Employment & Wages |
0 of 53 county reports for North Dakota are currently available. All 53 counties are scored and visible on the map above. New county reports are published weekly.
How County Scores Work
Each county is scored 0–100 using percentile-rank averaging across five data domains: Debt & Delinquency, Income & Poverty, Housing Cost Burden, Employment & Wages, and Community Vulnerability. A score of 50 means the county falls at the national median. Higher scores indicate greater financial distress.