Nevada County Distress Index
Financial distress scores for all 17 counties in Nevada, scored 0–100 across five domains. Mean score: 54.9. 4counties are in Serious Stress or Crisis.
Data: Census, BLS, Urban Institute, HUD, US Courts | Scores as of 2026-03-17
Nevada Snapshot
Nevada County Map
Loading interactive map…
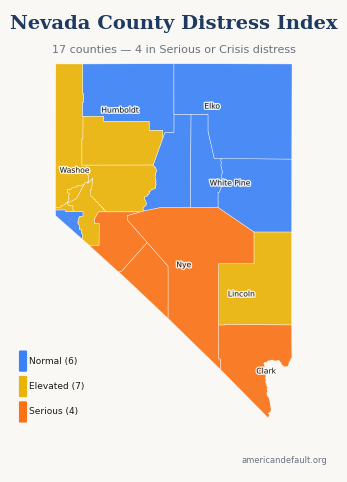
All 17 Nevada counties colored by distress zone. Hover for details; click released counties for full reports.
Most & Least Distressed
Most Distressed
Least Distressed
Score Distribution
How Nevada's 17 county scores are distributed across the 0–100 scale.
All Nevada Counties
17 counties ranked by distress score. Click column headers to sort.
| State Rank | Nat'l Rank | County | Score | Zone | Primary Driver |
|---|---|---|---|---|---|
| 1 | 59 | Esmeralda County | 75.5 | Serious Stress | Employment & Wages |
| 2 | 154 | Mineral County | 71.1 | Serious Stress | Employment & Wages |
| 3 | 352 | Nye County | 67.4 | Serious Stress | Community Vulnerability |
| 4 | 465 | Clark County | 65.6 | Serious Stress | Housing Cost Burden |
| 5 | 816 | Churchill County | 60.2 | Elevated | Community Vulnerability |
| 6 | 1,043 | Lincoln County | 57.5 | Elevated | Community Vulnerability |
| 7 | 1,079 | Lyon County | 57.0 | Elevated | Debt & Delinquency |
| 8 | 1,104 | Carson City | 56.5 | Elevated | Housing Cost Burden |
| 9 | 1,136 | Pershing County | 56.1 | Elevated | Debt & Delinquency |
| 10 | 1,493 | Washoe County | 51.2 | Elevated | Housing Cost Burden |
| 11 | 1,556 | Storey County | 50.5 | Elevated | Debt & Delinquency |
| 12 | 1,780 | White Pine County | 47.6 | Normal | Debt & Delinquency |
| 13 | 1,799 | Eureka County | 47.4 | Normal | Community Vulnerability |
| 14 | 2,028 | Elko County | 44.6 | Normal | Debt & Delinquency |
| 15 | 2,209 | Douglas County | 42.0 | Normal | Housing Cost Burden |
| 16 | 2,255 | Humboldt County | 41.5 | Normal | Debt & Delinquency |
| 17 | 2,268 | Lander County | 41.4 | Normal | Debt & Delinquency |
1 of 17 county reports for Nevada are currently available. All 17 counties are scored and visible on the map above. New county reports are published weekly.
How County Scores Work
Each county is scored 0–100 using percentile-rank averaging across five data domains: Debt & Delinquency, Income & Poverty, Housing Cost Burden, Employment & Wages, and Community Vulnerability. A score of 50 means the county falls at the national median. Higher scores indicate greater financial distress.