Nebraska County Distress Index
Financial distress scores for all 93 counties in Nebraska, scored 0–100 across five domains. Mean score: 36.6.
Data: Census, BLS, Urban Institute, HUD, US Courts | Scores as of 2026-03-17
Nebraska Snapshot
Nebraska County Map
Loading interactive map…
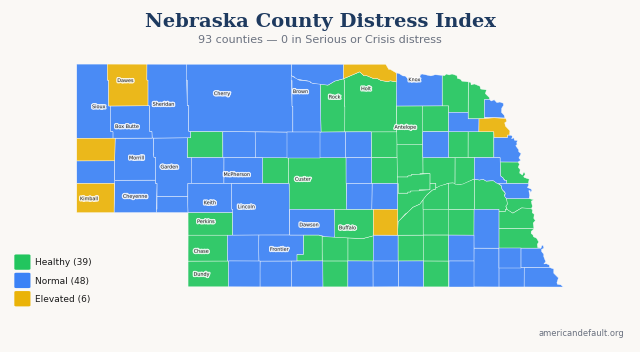
All 93 Nebraska counties colored by distress zone. Hover for details; click released counties for full reports.
Most & Least Distressed
Most Distressed
Least Distressed
Score Distribution
How Nebraska's 93 county scores are distributed across the 0–100 scale.
All Nebraska Counties
93 counties ranked by distress score. Click column headers to sort.
| State Rank | Nat'l Rank | County | Score | Zone | Primary Driver |
|---|---|---|---|---|---|
| 1 | 1,075 | Dawes County | 57.1 | Elevated | Housing Cost Burden |
| 2 | 1,085 | Scotts Bluff County | 56.9 | Elevated | Housing Cost Burden |
| 3 | 1,324 | Kimball County | 53.6 | Elevated | Community Vulnerability |
| 4 | 1,456 | Boyd County | 51.9 | Elevated | Income & Poverty |
| 5 | 1,461 | Thurston County | 51.8 | Elevated | Income & Poverty |
| 6 | 1,515 | Hall County | 51.0 | Elevated | Housing Cost Burden |
| 7 | 1,620 | Pawnee County | 49.6 | Normal | Community Vulnerability |
| 8 | 1,778 | Dakota County | 47.7 | Normal | Housing Cost Burden |
| 9 | 1,783 | Lincoln County | 47.6 | Normal | Community Vulnerability |
| 10 | 1,803 | Red Willow County | 47.3 | Normal | Community Vulnerability |
| 11 | 1,804 | Garden County | 47.3 | Normal | Income & Poverty |
| 12 | 1,852 | Sioux County | 46.7 | Normal | Employment & Wages |
| 13 | 1,865 | Deuel County | 46.4 | Normal | Employment & Wages |
| 14 | 1,871 | Jefferson County | 46.4 | Normal | Community Vulnerability |
| 15 | 1,891 | Hooker County | 46.1 | Normal | Community Vulnerability |
| 16 | 1,893 | Loup County | 46.1 | Normal | Income & Poverty |
| 17 | 1,913 | Hitchcock County | 45.8 | Normal | Income & Poverty |
| 18 | 1,941 | Sheridan County | 45.5 | Normal | Community Vulnerability |
| 19 | 1,994 | Cheyenne County | 45.0 | Normal | Housing Cost Burden |
| 20 | 2,018 | Arthur County | 44.7 | Normal | Income & Poverty |
| 21 | 2,033 | Frontier County | 44.5 | Normal | Employment & Wages |
| 22 | 2,048 | Brown County | 44.3 | Normal | Housing Cost Burden |
| 23 | 2,088 | Johnson County | 43.9 | Normal | Debt & Delinquency |
| 24 | 2,094 | Garfield County | 43.8 | Normal | Employment & Wages |
| 25 | 2,113 | Blaine County | 43.6 | Normal | Income & Poverty |
| 26 | 2,150 | Box Butte County | 42.9 | Normal | Employment & Wages |
| 27 | 2,168 | Furnas County | 42.6 | Normal | Community Vulnerability |
| 28 | 2,199 | Keith County | 42.1 | Normal | Income & Poverty |
| 29 | 2,214 | McPherson County | 42.0 | Normal | Employment & Wages |
| 30 | 2,236 | Sherman County | 41.6 | Normal | Employment & Wages |
| 31 | 2,249 | Hayes County | 41.5 | Normal | Employment & Wages |
| 32 | 2,267 | Douglas County | 41.4 | Normal | Housing Cost Burden |
| 33 | 2,271 | Banner County | 41.3 | Normal | Employment & Wages |
| 34 | 2,311 | Adams County | 40.7 | Normal | Housing Cost Burden |
| 35 | 2,322 | Nemaha County | 40.5 | Normal | Community Vulnerability |
| 36 | 2,357 | Thomas County | 39.9 | Normal | Employment & Wages |
| 37 | 2,364 | Cherry County | 39.7 | Normal | Income & Poverty |
| 38 | 2,367 | Gage County | 39.7 | Normal | Employment & Wages |
| 39 | 2,404 | Richardson County | 39.1 | Normal | Community Vulnerability |
| 40 | 2,410 | Dawson County | 39.0 | Normal | Community Vulnerability |
| 41 | 2,430 | Valley County | 38.7 | Normal | Income & Poverty |
| 42 | 2,450 | Keya Paha County | 38.4 | Normal | Income & Poverty |
| 43 | 2,461 | Franklin County | 38.2 | Normal | Community Vulnerability |
| 44 | 2,470 | Burt County | 38.1 | Normal | Community Vulnerability |
| 45 | 2,480 | Wayne County | 38.0 | Normal | Housing Cost Burden |
| 46 | 2,504 | Morrill County | 37.6 | Normal | Income & Poverty |
| 47 | 2,534 | Knox County | 37.0 | Normal | Income & Poverty |
| 48 | 2,550 | Dodge County | 36.8 | Normal | Housing Cost Burden |
| 49 | 2,571 | Webster County | 36.4 | Normal | Income & Poverty |
| 50 | 2,573 | Saline County | 36.4 | Normal | Employment & Wages |
| 51 | 2,595 | Howard County | 35.9 | Normal | Employment & Wages |
| 52 | 2,611 | Madison County | 35.7 | Normal | Housing Cost Burden |
| 53 | 2,635 | Nuckolls County | 35.4 | Normal | Community Vulnerability |
| 54 | 2,642 | Lancaster County | 35.2 | Normal | Housing Cost Burden |
| 55 | 2,694 | Buffalo County | 34.1 | Healthy | Housing Cost Burden |
| 56 | 2,706 | Wheeler County | 33.9 | Healthy | Income & Poverty |
| 57 | 2,732 | Merrick County | 33.5 | Healthy | Community Vulnerability |
| 58 | 2,736 | Nance County | 33.4 | Healthy | Community Vulnerability |
| 59 | 2,738 | Rock County | 33.4 | Healthy | Income & Poverty |
| 60 | 2,743 | Custer County | 33.3 | Healthy | Community Vulnerability |
| 61 | 2,781 | Dundy County | 32.4 | Healthy | Income & Poverty |
| 62 | 2,796 | Harlan County | 32.1 | Healthy | Community Vulnerability |
| 63 | 2,838 | Colfax County | 31.4 | Healthy | Employment & Wages |
| 64 | 2,847 | Logan County | 31.2 | Healthy | Housing Cost Burden |
| 65 | 2,859 | Cass County | 30.8 | Healthy | Employment & Wages |
| 66 | 2,866 | Grant County | 30.6 | Healthy | Income & Poverty |
| 67 | 2,888 | Greeley County | 29.9 | Healthy | Employment & Wages |
| 68 | 2,903 | York County | 29.4 | Healthy | Employment & Wages |
| 69 | 2,907 | Platte County | 29.3 | Healthy | Employment & Wages |
| 70 | 2,915 | Holt County | 29.1 | Healthy | Income & Poverty |
| 71 | 2,922 | Chase County | 28.9 | Healthy | Community Vulnerability |
| 72 | 2,935 | Thayer County | 28.5 | Healthy | Employment & Wages |
| 73 | 2,940 | Antelope County | 28.5 | Healthy | Debt & Delinquency |
| 74 | 2,944 | Gosper County | 28.4 | Healthy | Community Vulnerability |
| 75 | 2,952 | Sarpy County | 28.0 | Healthy | Housing Cost Burden |
| 76 | 2,958 | Perkins County | 28.0 | Healthy | Employment & Wages |
| 77 | 2,984 | Butler County | 27.0 | Healthy | Employment & Wages |
| 78 | 3,004 | Otoe County | 26.4 | Healthy | Employment & Wages |
| 79 | 3,005 | Stanton County | 26.3 | Healthy | Debt & Delinquency |
| 80 | 3,025 | Kearney County | 25.7 | Healthy | Employment & Wages |
| 81 | 3,029 | Cuming County | 25.5 | Healthy | Community Vulnerability |
| 82 | 3,040 | Phelps County | 24.6 | Healthy | Housing Cost Burden |
| 83 | 3,049 | Seward County | 24.3 | Healthy | Housing Cost Burden |
| 84 | 3,050 | Dixon County | 24.2 | Healthy | Community Vulnerability |
| 85 | 3,057 | Washington County | 23.9 | Healthy | Employment & Wages |
| 86 | 3,059 | Clay County | 23.8 | Healthy | Community Vulnerability |
| 87 | 3,066 | Cedar County | 23.5 | Healthy | Employment & Wages |
| 88 | 3,068 | Pierce County | 23.3 | Healthy | Debt & Delinquency |
| 89 | 3,071 | Fillmore County | 23.2 | Healthy | Debt & Delinquency |
| 90 | 3,072 | Polk County | 23.1 | Healthy | Employment & Wages |
| 91 | 3,077 | Saunders County | 22.5 | Healthy | Employment & Wages |
| 92 | 3,126 | Boone County | 18.7 | Healthy | Income & Poverty |
| 93 | 3,133 | Hamilton County | 17.5 | Healthy | Housing Cost Burden |
0 of 93 county reports for Nebraska are currently available. All 93 counties are scored and visible on the map above. New county reports are published weekly.
How County Scores Work
Each county is scored 0–100 using percentile-rank averaging across five data domains: Debt & Delinquency, Income & Poverty, Housing Cost Burden, Employment & Wages, and Community Vulnerability. A score of 50 means the county falls at the national median. Higher scores indicate greater financial distress.