Michigan County Distress Index
Financial distress scores for all 83 counties in Michigan, scored 0–100 across five domains. Mean score: 49.5. 5counties are in Serious Stress or Crisis.
Data: Census, BLS, Urban Institute, HUD, US Courts | Scores as of 2026-03-17
Michigan Snapshot
Michigan County Map
Loading interactive map…
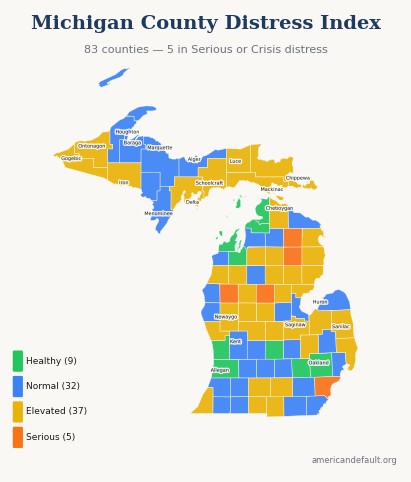
All 83 Michigan counties colored by distress zone. Hover for details; click released counties for full reports.
Most & Least Distressed
Most Distressed
Least Distressed
Score Distribution
How Michigan's 83 county scores are distributed across the 0–100 scale.
All Michigan Counties
83 counties ranked by distress score. Click column headers to sort.
| State Rank | Nat'l Rank | County | Score | Zone | Primary Driver |
|---|---|---|---|---|---|
| 1 | 188 | Oscoda County | 70.5 | Serious Stress | Community Vulnerability |
| 2 | 222 | Clare County | 69.7 | Serious Stress | Income & Poverty |
| 3 | 247 | Lake County | 69.2 | Serious Stress | Income & Poverty |
| 4 | 341 | Montmorency County | 67.5 | Serious Stress | Employment & Wages |
| 5 | 493 | Wayne County | 65.1 | Serious Stress | Housing Cost Burden |
| 6 | 576 | Ogemaw County | 63.7 | Elevated | Employment & Wages |
| 7 | 646 | Luce County | 62.6 | Elevated | Income & Poverty |
| 8 | 703 | Roscommon County | 61.7 | Elevated | Employment & Wages |
| 9 | 717 | Isabella County | 61.5 | Elevated | Housing Cost Burden |
| 10 | 718 | Iron County | 61.5 | Elevated | Income & Poverty |
| 11 | 738 | Genesee County | 61.2 | Elevated | Debt & Delinquency |
| 12 | 759 | Mecosta County | 60.9 | Elevated | Employment & Wages |
| 13 | 839 | Osceola County | 59.9 | Elevated | Income & Poverty |
| 14 | 861 | Gladwin County | 59.6 | Elevated | Employment & Wages |
| 15 | 890 | Saginaw County | 59.2 | Elevated | Housing Cost Burden |
| 16 | 903 | Arenac County | 59.1 | Elevated | Employment & Wages |
| 17 | 984 | Gogebic County | 58.1 | Elevated | Income & Poverty |
| 18 | 1,046 | Iosco County | 57.4 | Elevated | Income & Poverty |
| 19 | 1,086 | Mackinac County | 56.9 | Elevated | Employment & Wages |
| 20 | 1,087 | Calhoun County | 56.9 | Elevated | Debt & Delinquency |
| 21 | 1,141 | Crawford County | 56.0 | Elevated | Employment & Wages |
| 22 | 1,272 | Kalkaska County | 54.2 | Elevated | Debt & Delinquency |
| 23 | 1,320 | Ontonagon County | 53.6 | Elevated | Employment & Wages |
| 24 | 1,322 | Branch County | 53.6 | Elevated | Income & Poverty |
| 25 | 1,323 | Montcalm County | 53.6 | Elevated | Employment & Wages |
| 26 | 1,337 | Wexford County | 53.4 | Elevated | Housing Cost Burden |
| 27 | 1,351 | Muskegon County | 53.3 | Elevated | Employment & Wages |
| 28 | 1,372 | Alcona County | 53.0 | Elevated | Income & Poverty |
| 29 | 1,375 | Manistee County | 53.0 | Elevated | Employment & Wages |
| 30 | 1,408 | Schoolcraft County | 52.6 | Elevated | Employment & Wages |
| 31 | 1,411 | Cheboygan County | 52.5 | Elevated | Employment & Wages |
| 32 | 1,412 | Hillsdale County | 52.5 | Elevated | Employment & Wages |
| 33 | 1,417 | Sanilac County | 52.5 | Elevated | Employment & Wages |
| 34 | 1,452 | Jackson County | 52.1 | Elevated | Housing Cost Burden |
| 35 | 1,458 | St. Clair County | 51.9 | Elevated | Employment & Wages |
| 36 | 1,482 | Alpena County | 51.5 | Elevated | Income & Poverty |
| 37 | 1,491 | Chippewa County | 51.3 | Elevated | Employment & Wages |
| 38 | 1,569 | Gratiot County | 50.4 | Elevated | Employment & Wages |
| 39 | 1,570 | Newaygo County | 50.3 | Elevated | Employment & Wages |
| 40 | 1,573 | Tuscola County | 50.3 | Elevated | Employment & Wages |
| 41 | 1,580 | Delta County | 50.2 | Elevated | Employment & Wages |
| 42 | 1,594 | Berrien County | 50.1 | Elevated | Housing Cost Burden |
| 43 | 1,622 | Shiawassee County | 49.6 | Normal | Employment & Wages |
| 44 | 1,630 | Ionia County | 49.5 | Normal | Employment & Wages |
| 45 | 1,673 | St. Joseph County | 49.0 | Normal | Community Vulnerability |
| 46 | 1,687 | Missaukee County | 48.8 | Normal | Employment & Wages |
| 47 | 1,697 | Oceana County | 48.7 | Normal | Employment & Wages |
| 48 | 1,698 | Mason County | 48.7 | Normal | Employment & Wages |
| 49 | 1,704 | Menominee County | 48.5 | Normal | Employment & Wages |
| 50 | 1,714 | Lapeer County | 48.4 | Normal | Employment & Wages |
| 51 | 1,727 | Van Buren County | 48.3 | Normal | Employment & Wages |
| 52 | 1,728 | Bay County | 48.2 | Normal | Employment & Wages |
| 53 | 1,729 | Ingham County | 48.2 | Normal | Housing Cost Burden |
| 54 | 1,769 | Lenawee County | 47.7 | Normal | Employment & Wages |
| 55 | 1,795 | Keweenaw County | 47.5 | Normal | Employment & Wages |
| 56 | 1,831 | Presque Isle County | 47.0 | Normal | Employment & Wages |
| 57 | 1,851 | Baraga County | 46.7 | Normal | Employment & Wages |
| 58 | 1,854 | Cass County | 46.6 | Normal | Employment & Wages |
| 59 | 1,861 | Otsego County | 46.5 | Normal | Employment & Wages |
| 60 | 1,951 | Houghton County | 45.3 | Normal | Housing Cost Burden |
| 61 | 2,006 | Alger County | 44.8 | Normal | Employment & Wages |
| 62 | 2,007 | Marquette County | 44.8 | Normal | Housing Cost Burden |
| 63 | 2,024 | Benzie County | 44.6 | Normal | Employment & Wages |
| 64 | 2,059 | Monroe County | 44.2 | Normal | Employment & Wages |
| 65 | 2,081 | Macomb County | 43.9 | Normal | Housing Cost Burden |
| 66 | 2,096 | Kalamazoo County | 43.8 | Normal | Housing Cost Burden |
| 67 | 2,101 | Huron County | 43.8 | Normal | Employment & Wages |
| 68 | 2,131 | Dickinson County | 43.3 | Normal | Employment & Wages |
| 69 | 2,306 | Eaton County | 40.8 | Normal | Employment & Wages |
| 70 | 2,389 | Washtenaw County | 39.3 | Normal | Housing Cost Burden |
| 71 | 2,437 | Barry County | 38.6 | Normal | Employment & Wages |
| 72 | 2,486 | Antrim County | 37.9 | Normal | Employment & Wages |
| 73 | 2,500 | Kent County | 37.7 | Normal | Housing Cost Burden |
| 74 | 2,567 | Midland County | 36.4 | Normal | Housing Cost Burden |
| 75 | 2,747 | Emmet County | 33.2 | Healthy | Employment & Wages |
| 76 | 2,771 | Charlevoix County | 32.7 | Healthy | Employment & Wages |
| 77 | 2,777 | Allegan County | 32.6 | Healthy | Employment & Wages |
| 78 | 2,813 | Ottawa County | 31.8 | Healthy | Employment & Wages |
| 79 | 2,857 | Grand Traverse County | 30.9 | Healthy | Housing Cost Burden |
| 80 | 2,919 | Clinton County | 29.1 | Healthy | Employment & Wages |
| 81 | 2,941 | Oakland County | 28.5 | Healthy | Housing Cost Burden |
| 82 | 3,031 | Livingston County | 25.3 | Healthy | Employment & Wages |
| 83 | 3,033 | Leelanau County | 25.3 | Healthy | Employment & Wages |
2 of 83 county reports for Michigan are currently available. All 83 counties are scored and visible on the map above. New county reports are published weekly.
How County Scores Work
Each county is scored 0–100 using percentile-rank averaging across five data domains: Debt & Delinquency, Income & Poverty, Housing Cost Burden, Employment & Wages, and Community Vulnerability. A score of 50 means the county falls at the national median. Higher scores indicate greater financial distress.