Louisiana County Distress Index
Financial distress scores for all 64 counties in Louisiana, scored 0–100 across five domains. Mean score: 59.8. 24counties are in Serious Stress or Crisis.
Data: Census, BLS, Urban Institute, HUD, US Courts | Scores as of 2026-03-17
Louisiana Snapshot
Louisiana County Map
Loading interactive map…
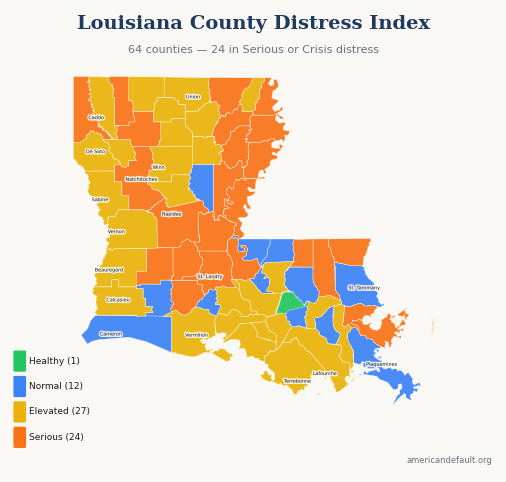
All 64 Louisiana counties colored by distress zone. Hover for details; click released counties for full reports.
Most & Least Distressed
Most Distressed
Least Distressed
Score Distribution
How Louisiana's 64 county scores are distributed across the 0–100 scale.
All Louisiana Counties
64 counties ranked by distress score. Click column headers to sort.
| State Rank | Nat'l Rank | County | Score | Zone | Primary Driver |
|---|---|---|---|---|---|
| 1 | 26 | Madison Parish | 77.2 | Serious Stress | Income & Poverty |
| 2 | 65 | East Carroll Parish | 75.0 | Serious Stress | Income & Poverty |
| 3 | 96 | Avoyelles Parish | 73.3 | Serious Stress | Income & Poverty |
| 4 | 106 | Concordia Parish | 72.8 | Serious Stress | Income & Poverty |
| 5 | 182 | Caddo Parish | 70.7 | Serious Stress | Debt & Delinquency |
| 6 | 191 | Catahoula Parish | 70.4 | Serious Stress | Income & Poverty |
| 7 | 199 | St. Helena Parish | 70.3 | Serious Stress | Income & Poverty |
| 8 | 200 | Morehouse Parish | 70.3 | Serious Stress | Income & Poverty |
| 9 | 268 | Natchitoches Parish | 68.8 | Serious Stress | Income & Poverty |
| 10 | 271 | Tensas Parish | 68.8 | Serious Stress | Income & Poverty |
| 11 | 288 | Tangipahoa Parish | 68.5 | Serious Stress | Debt & Delinquency |
| 12 | 290 | Washington Parish | 68.5 | Serious Stress | Income & Poverty |
| 13 | 299 | St. Bernard Parish | 68.3 | Serious Stress | Debt & Delinquency |
| 14 | 337 | Evangeline Parish | 67.5 | Serious Stress | Income & Poverty |
| 15 | 340 | Bienville Parish | 67.5 | Serious Stress | Income & Poverty |
| 16 | 350 | Richland Parish | 67.4 | Serious Stress | Income & Poverty |
| 17 | 398 | Webster Parish | 66.6 | Serious Stress | Debt & Delinquency |
| 18 | 399 | Orleans Parish | 66.6 | Serious Stress | Housing Cost Burden |
| 19 | 414 | Rapides Parish | 66.4 | Serious Stress | Debt & Delinquency |
| 20 | 430 | Allen Parish | 66.2 | Serious Stress | Debt & Delinquency |
| 21 | 436 | Acadia Parish | 66.1 | Serious Stress | Income & Poverty |
| 22 | 479 | St. Landry Parish | 65.4 | Serious Stress | Income & Poverty |
| 23 | 487 | Franklin Parish | 65.2 | Serious Stress | Income & Poverty |
| 24 | 497 | Pointe Coupee Parish | 65.0 | Serious Stress | Debt & Delinquency |
| 25 | 525 | Red River Parish | 64.6 | Elevated | Income & Poverty |
| 26 | 548 | Ouachita Parish | 64.2 | Elevated | Debt & Delinquency |
| 27 | 580 | Claiborne Parish | 63.7 | Elevated | Income & Poverty |
| 28 | 585 | Vernon Parish | 63.6 | Elevated | Employment & Wages |
| 29 | 601 | Caldwell Parish | 63.4 | Elevated | Income & Poverty |
| 30 | 644 | Jefferson Parish | 62.6 | Elevated | Housing Cost Burden |
| 31 | 657 | Winn Parish | 62.5 | Elevated | Income & Poverty |
| 32 | 673 | Iberia Parish | 62.3 | Elevated | Debt & Delinquency |
| 33 | 689 | St. Mary Parish | 62.0 | Elevated | Debt & Delinquency |
| 34 | 780 | Jackson Parish | 60.7 | Elevated | Debt & Delinquency |
| 35 | 830 | Assumption Parish | 60.0 | Elevated | Debt & Delinquency |
| 36 | 849 | Union Parish | 59.7 | Elevated | Income & Poverty |
| 37 | 863 | Lincoln Parish | 59.6 | Elevated | Income & Poverty |
| 38 | 875 | East Baton Rouge Parish | 59.5 | Elevated | Housing Cost Burden |
| 39 | 922 | Sabine Parish | 58.7 | Elevated | Debt & Delinquency |
| 40 | 931 | St. Martin Parish | 58.6 | Elevated | Debt & Delinquency |
| 41 | 974 | Calcasieu Parish | 58.2 | Elevated | Debt & Delinquency |
| 42 | 1,022 | Grant Parish | 57.6 | Elevated | Debt & Delinquency |
| 43 | 1,106 | West Carroll Parish | 56.5 | Elevated | Income & Poverty |
| 44 | 1,145 | De Soto Parish | 56.0 | Elevated | Debt & Delinquency |
| 45 | 1,150 | St. John the Baptist Parish | 55.9 | Elevated | Debt & Delinquency |
| 46 | 1,227 | Bossier Parish | 54.8 | Elevated | Debt & Delinquency |
| 47 | 1,284 | Terrebonne Parish | 54.0 | Elevated | Debt & Delinquency |
| 48 | 1,327 | Vermilion Parish | 53.6 | Elevated | Debt & Delinquency |
| 49 | 1,374 | Lafourche Parish | 53.0 | Elevated | Debt & Delinquency |
| 50 | 1,453 | Iberville Parish | 52.0 | Elevated | Debt & Delinquency |
| 51 | 1,484 | Beauregard Parish | 51.4 | Elevated | Debt & Delinquency |
| 52 | 1,617 | Jefferson Davis Parish | 49.6 | Normal | Debt & Delinquency |
| 53 | 1,663 | LaSalle Parish | 49.1 | Normal | Debt & Delinquency |
| 54 | 1,684 | Livingston Parish | 48.8 | Normal | Debt & Delinquency |
| 55 | 1,706 | St. Tammany Parish | 48.5 | Normal | Debt & Delinquency |
| 56 | 1,718 | East Feliciana Parish | 48.4 | Normal | Debt & Delinquency |
| 57 | 1,731 | Lafayette Parish | 48.2 | Normal | Debt & Delinquency |
| 58 | 1,929 | Plaquemines Parish | 45.6 | Normal | Debt & Delinquency |
| 59 | 1,932 | St. Charles Parish | 45.6 | Normal | Debt & Delinquency |
| 60 | 1,967 | West Feliciana Parish | 45.2 | Normal | Debt & Delinquency |
| 61 | 2,068 | West Baton Rouge Parish | 44.1 | Normal | Debt & Delinquency |
| 62 | 2,145 | St. James Parish | 43.0 | Normal | Debt & Delinquency |
| 63 | 2,476 | Cameron Parish | 38.1 | Normal | Debt & Delinquency |
| 64 | 2,712 | Ascension Parish | 33.8 | Healthy | Debt & Delinquency |
1 of 64 county reports for Louisiana are currently available. All 64 counties are scored and visible on the map above. New county reports are published weekly.
How County Scores Work
Each county is scored 0–100 using percentile-rank averaging across five data domains: Debt & Delinquency, Income & Poverty, Housing Cost Burden, Employment & Wages, and Community Vulnerability. A score of 50 means the county falls at the national median. Higher scores indicate greater financial distress.