Kansas County Distress Index
Financial distress scores for all 105 counties in Kansas, scored 0–100 across five domains. Mean score: 42.1. 2counties are in Serious Stress or Crisis.
Data: Census, BLS, Urban Institute, HUD, US Courts | Scores as of 2026-03-17
Kansas Snapshot
Kansas County Map
Loading interactive map…
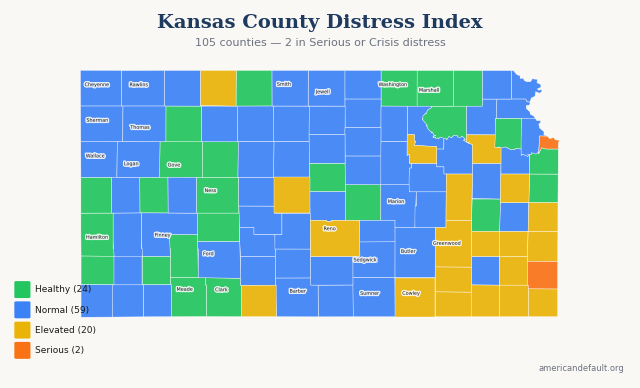
All 105 Kansas counties colored by distress zone. Hover for details; click released counties for full reports.
Most & Least Distressed
Most Distressed
Least Distressed
Score Distribution
How Kansas's 105 county scores are distributed across the 0–100 scale.
All Kansas Counties
105 counties ranked by distress score. Click column headers to sort.
| State Rank | Nat'l Rank | County | Score | Zone | Primary Driver |
|---|---|---|---|---|---|
| 1 | 245 | Wyandotte County | 69.3 | Serious Stress | Housing Cost Burden |
| 2 | 488 | Crawford County | 65.2 | Serious Stress | Housing Cost Burden |
| 3 | 632 | Elk County | 62.8 | Elevated | Income & Poverty |
| 4 | 706 | Labette County | 61.7 | Elevated | Community Vulnerability |
| 5 | 754 | Chautauqua County | 61.0 | Elevated | Community Vulnerability |
| 6 | 795 | Neosho County | 60.5 | Elevated | Community Vulnerability |
| 7 | 881 | Bourbon County | 59.3 | Elevated | Income & Poverty |
| 8 | 934 | Montgomery County | 58.5 | Elevated | Community Vulnerability |
| 9 | 969 | Geary County | 58.3 | Elevated | Debt & Delinquency |
| 10 | 1,163 | Cowley County | 55.7 | Elevated | Income & Poverty |
| 11 | 1,173 | Lyon County | 55.6 | Elevated | Housing Cost Burden |
| 12 | 1,239 | Greenwood County | 54.6 | Elevated | Community Vulnerability |
| 13 | 1,299 | Allen County | 53.9 | Elevated | Income & Poverty |
| 14 | 1,349 | Linn County | 53.3 | Elevated | Employment & Wages |
| 15 | 1,355 | Woodson County | 53.2 | Elevated | Income & Poverty |
| 16 | 1,369 | Cherokee County | 53.0 | Elevated | Community Vulnerability |
| 17 | 1,420 | Barton County | 52.4 | Elevated | Community Vulnerability |
| 18 | 1,437 | Franklin County | 52.2 | Elevated | Debt & Delinquency |
| 19 | 1,487 | Comanche County | 51.3 | Elevated | Community Vulnerability |
| 20 | 1,527 | Shawnee County | 50.8 | Elevated | Debt & Delinquency |
| 21 | 1,584 | Reno County | 50.2 | Elevated | Housing Cost Burden |
| 22 | 1,598 | Norton County | 50.0 | Elevated | Community Vulnerability |
| 23 | 1,603 | Sedgwick County | 50.0 | Normal | Housing Cost Burden |
| 24 | 1,634 | Russell County | 49.4 | Normal | Community Vulnerability |
| 25 | 1,658 | Sumner County | 49.2 | Normal | Employment & Wages |
| 26 | 1,713 | Saline County | 48.4 | Normal | Housing Cost Burden |
| 27 | 1,742 | Sherman County | 48.1 | Normal | Community Vulnerability |
| 28 | 1,744 | Riley County | 48.0 | Normal | Housing Cost Burden |
| 29 | 1,757 | Cheyenne County | 47.9 | Normal | Community Vulnerability |
| 30 | 1,787 | Seward County | 47.5 | Normal | Housing Cost Burden |
| 31 | 1,829 | Osage County | 47.0 | Normal | Employment & Wages |
| 32 | 1,881 | Wilson County | 46.2 | Normal | Income & Poverty |
| 33 | 1,882 | Finney County | 46.2 | Normal | Debt & Delinquency |
| 34 | 1,888 | Harper County | 46.1 | Normal | Community Vulnerability |
| 35 | 1,931 | Pawnee County | 45.6 | Normal | Community Vulnerability |
| 36 | 1,958 | Decatur County | 45.3 | Normal | Income & Poverty |
| 37 | 1,959 | Smith County | 45.3 | Normal | Community Vulnerability |
| 38 | 1,960 | Jewell County | 45.3 | Normal | Employment & Wages |
| 39 | 2,001 | Douglas County | 44.9 | Normal | Housing Cost Burden |
| 40 | 2,012 | Clay County | 44.8 | Normal | Employment & Wages |
| 41 | 2,056 | Lincoln County | 44.2 | Normal | Community Vulnerability |
| 42 | 2,080 | Morton County | 43.9 | Normal | Community Vulnerability |
| 43 | 2,098 | Cloud County | 43.8 | Normal | Employment & Wages |
| 44 | 2,146 | Ellis County | 43.0 | Normal | Housing Cost Burden |
| 45 | 2,155 | Kingman County | 42.8 | Normal | Community Vulnerability |
| 46 | 2,157 | Kearny County | 42.7 | Normal | Community Vulnerability |
| 47 | 2,195 | Chase County | 42.2 | Normal | Employment & Wages |
| 48 | 2,198 | Kiowa County | 42.2 | Normal | Employment & Wages |
| 49 | 2,208 | Osborne County | 42.0 | Normal | Employment & Wages |
| 50 | 2,227 | Leavenworth County | 41.8 | Normal | Employment & Wages |
| 51 | 2,231 | Wallace County | 41.7 | Normal | Income & Poverty |
| 52 | 2,241 | Doniphan County | 41.6 | Normal | Employment & Wages |
| 53 | 2,259 | Anderson County | 41.4 | Normal | Community Vulnerability |
| 54 | 2,265 | Logan County | 41.4 | Normal | Community Vulnerability |
| 55 | 2,287 | Brown County | 41.0 | Normal | Community Vulnerability |
| 56 | 2,297 | Morris County | 40.9 | Normal | Employment & Wages |
| 57 | 2,301 | Harvey County | 40.8 | Normal | Employment & Wages |
| 58 | 2,312 | Ford County | 40.7 | Normal | Debt & Delinquency |
| 59 | 2,313 | Graham County | 40.7 | Normal | Employment & Wages |
| 60 | 2,328 | Dickinson County | 40.3 | Normal | Community Vulnerability |
| 61 | 2,333 | Lane County | 40.2 | Normal | Community Vulnerability |
| 62 | 2,350 | Edwards County | 40.0 | Normal | Community Vulnerability |
| 63 | 2,366 | Jackson County | 39.7 | Normal | Employment & Wages |
| 64 | 2,381 | Butler County | 39.5 | Normal | Housing Cost Burden |
| 65 | 2,428 | Atchison County | 38.7 | Normal | Community Vulnerability |
| 66 | 2,432 | Rush County | 38.6 | Normal | Income & Poverty |
| 67 | 2,434 | Stafford County | 38.6 | Normal | Income & Poverty |
| 68 | 2,455 | Barber County | 38.3 | Normal | Community Vulnerability |
| 69 | 2,459 | Republic County | 38.3 | Normal | Income & Poverty |
| 70 | 2,481 | Marion County | 37.9 | Normal | Employment & Wages |
| 71 | 2,493 | Wabaunsee County | 37.8 | Normal | Community Vulnerability |
| 72 | 2,515 | Mitchell County | 37.4 | Normal | Community Vulnerability |
| 73 | 2,519 | Stevens County | 37.3 | Normal | Community Vulnerability |
| 74 | 2,531 | Rooks County | 37.1 | Normal | Employment & Wages |
| 75 | 2,545 | Rice County | 36.9 | Normal | Debt & Delinquency |
| 76 | 2,572 | Rawlins County | 36.4 | Normal | Community Vulnerability |
| 77 | 2,587 | Wichita County | 36.1 | Normal | Community Vulnerability |
| 78 | 2,604 | Grant County | 35.8 | Normal | Community Vulnerability |
| 79 | 2,619 | Thomas County | 35.6 | Normal | Housing Cost Burden |
| 80 | 2,620 | Ottawa County | 35.6 | Normal | Debt & Delinquency |
| 81 | 2,646 | Pratt County | 35.2 | Normal | Community Vulnerability |
| 82 | 2,660 | Hodgeman County | 34.8 | Healthy | Employment & Wages |
| 83 | 2,692 | Marshall County | 34.1 | Healthy | Housing Cost Burden |
| 84 | 2,693 | Miami County | 34.1 | Healthy | Housing Cost Burden |
| 85 | 2,704 | Coffey County | 33.9 | Healthy | Community Vulnerability |
| 86 | 2,714 | Hamilton County | 33.8 | Healthy | Community Vulnerability |
| 87 | 2,724 | Phillips County | 33.5 | Healthy | Community Vulnerability |
| 88 | 2,731 | Stanton County | 33.5 | Healthy | Community Vulnerability |
| 89 | 2,746 | Clark County | 33.2 | Healthy | Community Vulnerability |
| 90 | 2,822 | Haskell County | 31.6 | Healthy | Community Vulnerability |
| 91 | 2,880 | Ellsworth County | 30.2 | Healthy | Employment & Wages |
| 92 | 2,917 | Sheridan County | 29.1 | Healthy | Community Vulnerability |
| 93 | 2,923 | Jefferson County | 28.9 | Healthy | Employment & Wages |
| 94 | 2,936 | Washington County | 28.5 | Healthy | Income & Poverty |
| 95 | 2,964 | Greeley County | 27.7 | Healthy | Community Vulnerability |
| 96 | 2,967 | Trego County | 27.6 | Healthy | Income & Poverty |
| 97 | 2,971 | Gove County | 27.4 | Healthy | Community Vulnerability |
| 98 | 2,973 | McPherson County | 27.3 | Healthy | Housing Cost Burden |
| 99 | 2,978 | Meade County | 27.1 | Healthy | Community Vulnerability |
| 100 | 2,985 | Scott County | 26.9 | Healthy | Debt & Delinquency |
| 101 | 3,018 | Ness County | 25.9 | Healthy | Community Vulnerability |
| 102 | 3,045 | Pottawatomie County | 24.5 | Healthy | Employment & Wages |
| 103 | 3,051 | Gray County | 24.2 | Healthy | Community Vulnerability |
| 104 | 3,080 | Johnson County | 22.3 | Healthy | Housing Cost Burden |
| 105 | 3,130 | Nemaha County | 18.3 | Healthy | Employment & Wages |
0 of 105 county reports for Kansas are currently available. All 105 counties are scored and visible on the map above. New county reports are published weekly.
How County Scores Work
Each county is scored 0–100 using percentile-rank averaging across five data domains: Debt & Delinquency, Income & Poverty, Housing Cost Burden, Employment & Wages, and Community Vulnerability. A score of 50 means the county falls at the national median. Higher scores indicate greater financial distress.