Des Moines County, Iowa
Above the national median for severe rent burden (50%+).
Main Findings
Des Moines County, Iowa ranks 1,440th most distressed in the United States on the County Distress Index. The driver: 32% of renter households pay 50%+ of income on rent — above the national median of 18%.
- 1,440th of 3,144 counties on the County Distress Index — 53.0 · moderate county distress, 2nd in Iowa.
- 32% of renter households pay 50%+ of income on rent (U.S. median 18%). Severe rent burden (50%+) at the 99th percentile nationally.
- Bankruptcy filing rate at 167 — national median 126, ranked at the 66th percentile.
- Auto loan delinquency at 7% — national median 5%, ranked at the 69th percentile.
- Child poverty rate at 21% — national median 18%, ranked at the 65th percentile.
"Des Moines County has a moderate county distress score. The county sits near the middle of the CDI score scale, so the domain mix carries the story."
"The CDI gives this county a moderate county distress label. The domain mix matters because the same composite score can come from very different local conditions."
Reporter's Notes
Two data points in the indicator table worth a follow-up call.
Des Moines County's uninsured rate indicator is at the 8th percentile — while every other indicator in the safety_net_buffer domain sits at or above the 43rd percentile. The gap stands out against the other credit indicators. Worth a call to Urban Institute or a local credit counselor in Burlington.
Indicator History
Period-correct raw indicators from the county-history panel. The CDI composite is excluded because it is a current cross-sectional score.
Unemployment rate
Poverty rate
Transfer income share
Subprime credit population
The Indicators Behind Des Moines County's CDI Score
Every number traces to a public source. Des Moines County's value shown alongside IA's median and the U.S. median. Full CSV available for download.
| Indicator | Des Moines | IA median | U.S. median | Pctile | Source |
|---|---|---|---|---|---|
| Delinquency — domain score 56 · Rank 1,335 of 3,144 | |||||
| Auto loan delinquency Share of auto loan accounts 60+ days past due | 7% | 3% | 5% | 69th | Urban Institute (2024) |
| Credit card delinquency Share of credit card accounts 60+ days past due | 6% | 4% | 5% | 53rd | Urban Institute (2024) |
| Subprime credit share Share of residents with a credit score below 660 | 23% | 17% | 23% | 47th | Urban Institute (2024) |
| Default & Legal — domain score 61 · Rank 1,076 of 3,144 | |||||
| Debt in collections Share of residents with a credit file who have debt in collections | 25% | 17% | 23% | 56th | Urban Institute (2024) |
| Bankruptcy filing rate Personal bankruptcy filings per 100,000 residents | 167 | 101 | 126 | 66th | US Courts F-5A (2025) |
| Debt Burden (housing basis) — domain score 74 · Rank 578 of 3,144 | |||||
| Rent-to-income ratio Fair Market Rent (2BR) as share of median household income | 21% | 17% | 21% | 50th | HUD FMR × Census ACS (2024) |
| Severe rent burden (50%+) Share of renter households paying 50%+ of income on rent | 32% | 17% | 18% | 99th | Census ACS 5-yr (2023) |
| Labor — domain score 24 · Rank 2,361 of 3,144 | |||||
| Unemployment Share of labor force unemployed | 3% | 2% | 4% | 24th | BLS LAUS (Dec 2025) |
| Safety Net & Buffer — domain score 50 · Rank 1,586 of 3,144 | |||||
| Child poverty rate Share of children under 18 below the federal poverty line | 21% | 14% | 18% | 65th | Census SAIPE (2023) |
| Disability rate Share of residents reporting a disability | 16% | 14% | 16% | 56th | Census ACS 5-yr (2023) |
| Poverty rate Share of population below the federal poverty line | 14% | 10% | 14% | 56th | Census SAIPE (2023) |
| Transfer-income dependency Share of personal income from government transfers | 26% | 23% | 27% | 43rd | BEA Regional Personal Income (2023) |
| Uninsured rate Share of residents without health insurance coverage | 4% | 5% | 8% | 8th | Census ACS 5-yr (2023) |
Five-Domain Breakdown
The CDI is an equal-weight composite of five family-v1 distress domains. Each domain contributes 20% of the county score.
Methodology
The County Distress Index is a 0–100 composite score of household financial distress, computed for all 3,144 U.S. counties. Higher scores indicate greater distress. The index is built from five equal-weighted domains: Delinquency, Default & Legal, Debt Burden, Labor, and Safety Net & Buffer. Each domain is the mean of distress-oriented indicator percentiles; the CDI score is the equal-weight mean of those domain scores.
Data sources include the Urban Institute Debt in America (Equifax consumer credit panel), U.S. Census Bureau (American Community Survey 5-year, Small Area Income and Poverty Estimates, Business Formation Statistics), Bureau of Labor Statistics (Local Area Unemployment Statistics, Quarterly Census of Employment and Wages), U.S. Courts Administrative Office (F-5A bankruptcy filings), and HUD Fair Market Rents. Data vintages range from 2023 to 2025 depending on source; full indicator-level vintage detail is in the methodology document.
For Press & Research
Everything you need to cite Des Moines County data — in under 60 seconds.
Draft wire copy 159-word AP-style article — use freely with attribution
BURLINGTON, Iowa — Des Moines County ranks 1,440th among the nation's most financially distressed counties, according to the County Distress Index released this month by American Default Research.
The composite score of 53.0 out of 100 gives Des Moines a moderate county distress label. Among 3,144 U.S. counties scored, 1,439 counties rank more distressed. Within Iowa, Des Moines ranks second of 99 counties.
The index, which draws on 16 source indicators from the U.S. Census Bureau, Bureau of Labor Statistics, Urban Institute and federal court filings, identifies debt burden (housing basis) as the primary driver in Des Moines. 32% of renter households pay 50%+ of income on rent — above the national median of 18%.
"Des Moines County has a moderate county distress score. The county sits near the middle of the CDI score scale, so the domain mix carries the story," said Ross Kilburn, founder of American Default Research.
Full methodology and county-by-county data are available at americandefault.org/methodology/cdi.
Frequently Asked Questions
What is Des Moines County's CDI score, and what does it mean?
What drives Des Moines County's distress score?
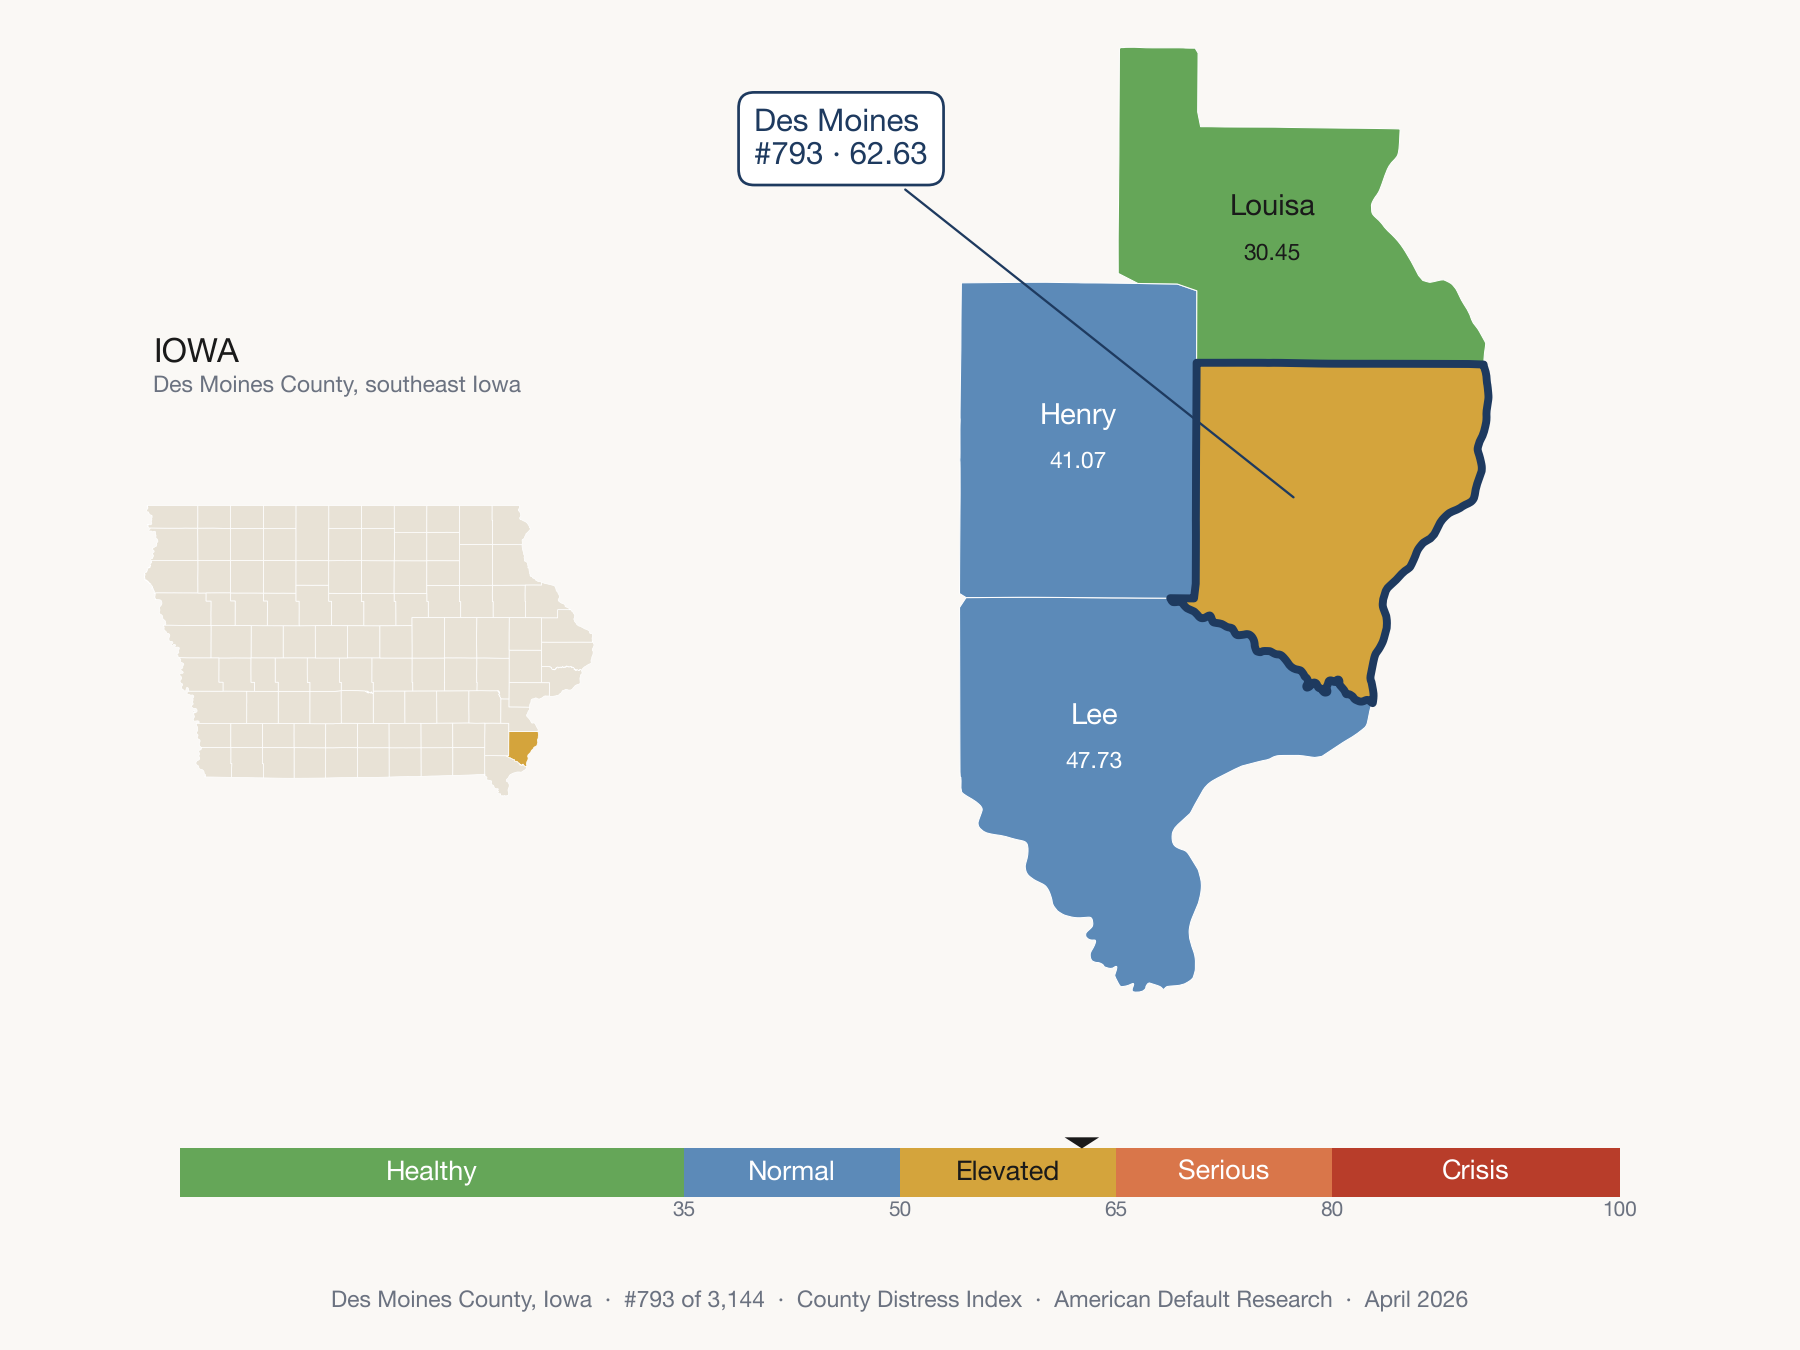
How does Des Moines County compare to its neighbors?
How is the County Distress Index calculated?

Des Moines County resident looking for help? HUD counselors, legal aid, and attorney referrals →