Iowa County Distress Index
Financial distress scores for all 99 counties in Iowa, scored 0–100 across five domains. Mean score: 34.3.
Data: Census, BLS, Urban Institute, HUD, US Courts | Scores as of 2026-03-17
Iowa Snapshot
Iowa County Map
Loading interactive map…
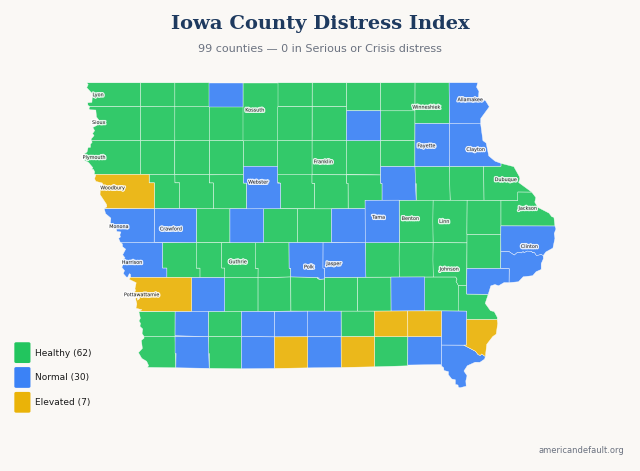
All 99 Iowa counties colored by distress zone. Hover for details; click released counties for full reports.
Most & Least Distressed
Most Distressed
Least Distressed
Score Distribution
How Iowa's 99 county scores are distributed across the 0–100 scale.
All Iowa Counties
99 counties ranked by distress score. Click column headers to sort.
| State Rank | Nat'l Rank | County | Score | Zone | Primary Driver |
|---|---|---|---|---|---|
| 1 | 911 | Wapello County | 58.9 | Elevated | Debt & Delinquency |
| 2 | 939 | Des Moines County | 58.5 | Elevated | Housing Cost Burden |
| 3 | 991 | Appanoose County | 58.0 | Elevated | Income & Poverty |
| 4 | 1,463 | Decatur County | 51.8 | Elevated | Income & Poverty |
| 5 | 1,531 | Woodbury County | 50.8 | Elevated | Employment & Wages |
| 6 | 1,579 | Jefferson County | 50.2 | Elevated | Housing Cost Burden |
| 7 | 1,596 | Pottawattamie County | 50.0 | Elevated | Housing Cost Burden |
| 8 | 1,612 | Van Buren County | 49.7 | Normal | Community Vulnerability |
| 9 | 1,637 | Lee County | 49.4 | Normal | Income & Poverty |
| 10 | 1,648 | Lucas County | 49.3 | Normal | Income & Poverty |
| 11 | 1,838 | Clinton County | 46.9 | Normal | Housing Cost Burden |
| 12 | 1,857 | Montgomery County | 46.6 | Normal | Income & Poverty |
| 13 | 1,896 | Cass County | 46.0 | Normal | Income & Poverty |
| 14 | 1,986 | Black Hawk County | 45.0 | Normal | Housing Cost Burden |
| 15 | 1,991 | Union County | 45.0 | Normal | Income & Poverty |
| 16 | 2,092 | Webster County | 43.8 | Normal | Income & Poverty |
| 17 | 2,109 | Wayne County | 43.7 | Normal | Income & Poverty |
| 18 | 2,122 | Fayette County | 43.5 | Normal | Income & Poverty |
| 19 | 2,129 | Page County | 43.3 | Normal | Income & Poverty |
| 20 | 2,133 | Crawford County | 43.2 | Normal | Employment & Wages |
| 21 | 2,273 | Tama County | 41.3 | Normal | Employment & Wages |
| 22 | 2,289 | Marshall County | 41.0 | Normal | Employment & Wages |
| 23 | 2,295 | Clarke County | 40.9 | Normal | Community Vulnerability |
| 24 | 2,296 | Henry County | 40.9 | Normal | Employment & Wages |
| 25 | 2,362 | Muscatine County | 39.7 | Normal | Housing Cost Burden |
| 26 | 2,365 | Emmet County | 39.7 | Normal | Community Vulnerability |
| 27 | 2,368 | Ringgold County | 39.7 | Normal | Income & Poverty |
| 28 | 2,371 | Greene County | 39.6 | Normal | Income & Poverty |
| 29 | 2,380 | Clayton County | 39.5 | Normal | Employment & Wages |
| 30 | 2,401 | Jasper County | 39.1 | Normal | Employment & Wages |
| 31 | 2,439 | Allamakee County | 38.6 | Normal | Employment & Wages |
| 32 | 2,444 | Monona County | 38.5 | Normal | Income & Poverty |
| 33 | 2,468 | Scott County | 38.1 | Normal | Housing Cost Burden |
| 34 | 2,574 | Keokuk County | 36.3 | Normal | Income & Poverty |
| 35 | 2,582 | Harrison County | 36.1 | Normal | Employment & Wages |
| 36 | 2,596 | Floyd County | 35.8 | Normal | Employment & Wages |
| 37 | 2,602 | Polk County | 35.8 | Normal | Housing Cost Burden |
| 38 | 2,653 | Monroe County | 34.9 | Healthy | Debt & Delinquency |
| 39 | 2,663 | Story County | 34.7 | Healthy | Housing Cost Burden |
| 40 | 2,672 | Davis County | 34.6 | Healthy | Community Vulnerability |
| 41 | 2,681 | Taylor County | 34.4 | Healthy | Income & Poverty |
| 42 | 2,683 | Franklin County | 34.3 | Healthy | Community Vulnerability |
| 43 | 2,696 | Pocahontas County | 34.0 | Healthy | Community Vulnerability |
| 44 | 2,698 | Johnson County | 34.0 | Healthy | Housing Cost Burden |
| 45 | 2,707 | Buena Vista County | 33.9 | Healthy | Income & Poverty |
| 46 | 2,715 | Adams County | 33.8 | Healthy | Income & Poverty |
| 47 | 2,717 | Audubon County | 33.7 | Healthy | Housing Cost Burden |
| 48 | 2,726 | Winnebago County | 33.5 | Healthy | Employment & Wages |
| 49 | 2,728 | Hardin County | 33.5 | Healthy | Housing Cost Burden |
| 50 | 2,729 | Poweshiek County | 33.5 | Healthy | Housing Cost Burden |
| 51 | 2,733 | Cerro Gordo County | 33.5 | Healthy | Employment & Wages |
| 52 | 2,745 | Osceola County | 33.2 | Healthy | Housing Cost Burden |
| 53 | 2,769 | Jackson County | 32.7 | Healthy | Employment & Wages |
| 54 | 2,782 | Cherokee County | 32.4 | Healthy | Housing Cost Burden |
| 55 | 2,816 | Mills County | 31.7 | Healthy | Employment & Wages |
| 56 | 2,818 | Clay County | 31.7 | Healthy | Housing Cost Burden |
| 57 | 2,819 | Linn County | 31.7 | Healthy | Housing Cost Burden |
| 58 | 2,831 | Washington County | 31.5 | Healthy | Housing Cost Burden |
| 59 | 2,833 | Dubuque County | 31.5 | Healthy | Housing Cost Burden |
| 60 | 2,850 | Adair County | 31.1 | Healthy | Debt & Delinquency |
| 61 | 2,853 | Louisa County | 31.0 | Healthy | Employment & Wages |
| 62 | 2,862 | Palo Alto County | 30.7 | Healthy | Employment & Wages |
| 63 | 2,877 | Wright County | 30.2 | Healthy | Debt & Delinquency |
| 64 | 2,892 | Howard County | 29.8 | Healthy | Employment & Wages |
| 65 | 2,901 | Madison County | 29.6 | Healthy | Employment & Wages |
| 66 | 2,904 | Mahaska County | 29.4 | Healthy | Employment & Wages |
| 67 | 2,916 | Calhoun County | 29.1 | Healthy | Income & Poverty |
| 68 | 2,928 | Jones County | 28.9 | Healthy | Employment & Wages |
| 69 | 2,943 | Shelby County | 28.4 | Healthy | Debt & Delinquency |
| 70 | 2,946 | Dickinson County | 28.3 | Healthy | Employment & Wages |
| 71 | 2,948 | Kossuth County | 28.3 | Healthy | Income & Poverty |
| 72 | 2,953 | Cedar County | 28.0 | Healthy | Housing Cost Burden |
| 73 | 2,954 | Delaware County | 28.0 | Healthy | Employment & Wages |
| 74 | 2,955 | Guthrie County | 28.0 | Healthy | Employment & Wages |
| 75 | 2,965 | Iowa County | 27.7 | Healthy | Employment & Wages |
| 76 | 2,972 | Worth County | 27.4 | Healthy | Employment & Wages |
| 77 | 2,974 | O'Brien County | 27.3 | Healthy | Housing Cost Burden |
| 78 | 2,979 | Fremont County | 27.1 | Healthy | Debt & Delinquency |
| 79 | 2,981 | Buchanan County | 27.1 | Healthy | Employment & Wages |
| 80 | 2,995 | Carroll County | 26.6 | Healthy | Housing Cost Burden |
| 81 | 3,011 | Chickasaw County | 26.0 | Healthy | Community Vulnerability |
| 82 | 3,012 | Humboldt County | 26.0 | Healthy | Community Vulnerability |
| 83 | 3,014 | Hamilton County | 26.0 | Healthy | Employment & Wages |
| 84 | 3,030 | Hancock County | 25.5 | Healthy | Housing Cost Burden |
| 85 | 3,048 | Warren County | 24.3 | Healthy | Employment & Wages |
| 86 | 3,056 | Marion County | 23.9 | Healthy | Housing Cost Burden |
| 87 | 3,062 | Mitchell County | 23.7 | Healthy | Employment & Wages |
| 88 | 3,064 | Ida County | 23.6 | Healthy | Employment & Wages |
| 89 | 3,070 | Boone County | 23.2 | Healthy | Employment & Wages |
| 90 | 3,087 | Butler County | 22.1 | Healthy | Employment & Wages |
| 91 | 3,090 | Benton County | 21.9 | Healthy | Employment & Wages |
| 92 | 3,094 | Sac County | 21.8 | Healthy | Income & Poverty |
| 93 | 3,104 | Sioux County | 21.0 | Healthy | Housing Cost Burden |
| 94 | 3,110 | Bremer County | 20.6 | Healthy | Employment & Wages |
| 95 | 3,117 | Winneshiek County | 19.8 | Healthy | Employment & Wages |
| 96 | 3,122 | Dallas County | 19.1 | Healthy | Housing Cost Burden |
| 97 | 3,128 | Plymouth County | 18.5 | Healthy | Housing Cost Burden |
| 98 | 3,129 | Grundy County | 18.4 | Healthy | Employment & Wages |
| 99 | 3,136 | Lyon County | 16.9 | Healthy | Employment & Wages |
0 of 99 county reports for Iowa are currently available. All 99 counties are scored and visible on the map above. New county reports are published weekly.
How County Scores Work
Each county is scored 0–100 using percentile-rank averaging across five data domains: Debt & Delinquency, Income & Poverty, Housing Cost Burden, Employment & Wages, and Community Vulnerability. A score of 50 means the county falls at the national median. Higher scores indicate greater financial distress.