Illinois County Distress Index
Financial distress scores for all 102 counties in Illinois, scored 0–100 across five domains. Mean score: 44.5. 2counties are in Serious Stress or Crisis.
Data: Census, BLS, Urban Institute, HUD, US Courts | Scores as of 2026-03-17
Illinois Snapshot
Illinois County Map
Loading interactive map…
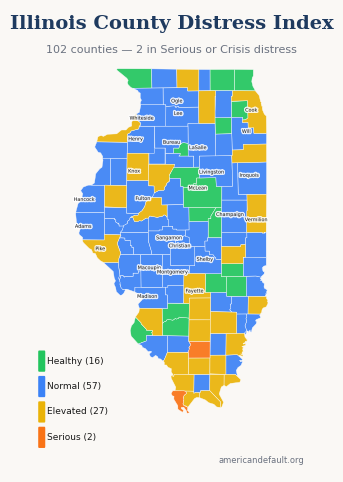
All 102 Illinois counties colored by distress zone. Hover for details; click released counties for full reports.
Most & Least Distressed
Most Distressed
Least Distressed
Score Distribution
How Illinois's 102 county scores are distributed across the 0–100 scale.
All Illinois Counties
102 counties ranked by distress score. Click column headers to sort.
| State Rank | Nat'l Rank | County | Score | Zone | Primary Driver |
|---|---|---|---|---|---|
| 1 | 470 | Franklin County | 65.6 | Serious Stress | Income & Poverty |
| 2 | 483 | Alexander County | 65.3 | Serious Stress | Income & Poverty |
| 3 | 567 | Jackson County | 63.9 | Elevated | Income & Poverty |
| 4 | 607 | McDonough County | 63.3 | Elevated | Income & Poverty |
| 5 | 633 | Saline County | 62.7 | Elevated | Income & Poverty |
| 6 | 705 | Pulaski County | 61.7 | Elevated | Income & Poverty |
| 7 | 920 | Jefferson County | 58.7 | Elevated | Income & Poverty |
| 8 | 943 | Marion County | 58.5 | Elevated | Income & Poverty |
| 9 | 985 | Vermilion County | 58.1 | Elevated | Income & Poverty |
| 10 | 1,021 | Knox County | 57.6 | Elevated | Employment & Wages |
| 11 | 1,097 | Winnebago County | 56.7 | Elevated | Housing Cost Burden |
| 12 | 1,105 | Williamson County | 56.5 | Elevated | Income & Poverty |
| 13 | 1,112 | Massac County | 56.5 | Elevated | Income & Poverty |
| 14 | 1,187 | Kankakee County | 55.2 | Elevated | Housing Cost Burden |
| 15 | 1,196 | Coles County | 55.1 | Elevated | Income & Poverty |
| 16 | 1,197 | Lawrence County | 55.1 | Elevated | Income & Poverty |
| 17 | 1,237 | St. Clair County | 54.6 | Elevated | Housing Cost Burden |
| 18 | 1,269 | Rock Island County | 54.2 | Elevated | Housing Cost Burden |
| 19 | 1,289 | Hardin County | 54.0 | Elevated | Income & Poverty |
| 20 | 1,338 | Peoria County | 53.4 | Elevated | Housing Cost Burden |
| 21 | 1,339 | Wayne County | 53.4 | Elevated | Employment & Wages |
| 22 | 1,399 | Fayette County | 52.7 | Elevated | Employment & Wages |
| 23 | 1,427 | Pike County | 52.4 | Elevated | Employment & Wages |
| 24 | 1,441 | Union County | 52.2 | Elevated | Employment & Wages |
| 25 | 1,466 | DeKalb County | 51.7 | Elevated | Housing Cost Burden |
| 26 | 1,492 | White County | 51.3 | Elevated | Income & Poverty |
| 27 | 1,529 | Pope County | 50.8 | Elevated | Employment & Wages |
| 28 | 1,532 | Cook County | 50.8 | Elevated | Housing Cost Burden |
| 29 | 1,537 | Mason County | 50.7 | Elevated | Employment & Wages |
| 30 | 1,607 | Perry County | 49.8 | Normal | Income & Poverty |
| 31 | 1,614 | Johnson County | 49.7 | Normal | Employment & Wages |
| 32 | 1,629 | Macon County | 49.5 | Normal | Income & Poverty |
| 33 | 1,675 | Wabash County | 49.0 | Normal | Employment & Wages |
| 34 | 1,751 | Henderson County | 48.0 | Normal | Employment & Wages |
| 35 | 1,791 | Adams County | 47.5 | Normal | Employment & Wages |
| 36 | 1,800 | Gallatin County | 47.4 | Normal | Income & Poverty |
| 37 | 1,801 | Montgomery County | 47.4 | Normal | Income & Poverty |
| 38 | 1,806 | Clay County | 47.3 | Normal | Employment & Wages |
| 39 | 1,820 | Richland County | 47.1 | Normal | Employment & Wages |
| 40 | 1,828 | Logan County | 47.0 | Normal | Employment & Wages |
| 41 | 1,837 | Stark County | 46.9 | Normal | Employment & Wages |
| 42 | 1,874 | Stephenson County | 46.3 | Normal | Employment & Wages |
| 43 | 1,890 | Hamilton County | 46.1 | Normal | Community Vulnerability |
| 44 | 1,904 | Edwards County | 46.0 | Normal | Employment & Wages |
| 45 | 1,908 | Greene County | 45.9 | Normal | Employment & Wages |
| 46 | 1,928 | Schuyler County | 45.6 | Normal | Employment & Wages |
| 47 | 1,939 | Morgan County | 45.5 | Normal | Employment & Wages |
| 48 | 1,945 | Christian County | 45.4 | Normal | Employment & Wages |
| 49 | 2,013 | Fulton County | 44.8 | Normal | Employment & Wages |
| 50 | 2,020 | Macoupin County | 44.7 | Normal | Employment & Wages |
| 51 | 2,025 | Edgar County | 44.6 | Normal | Income & Poverty |
| 52 | 2,040 | Champaign County | 44.4 | Normal | Housing Cost Burden |
| 53 | 2,044 | Cass County | 44.3 | Normal | Employment & Wages |
| 54 | 2,045 | Carroll County | 44.3 | Normal | Employment & Wages |
| 55 | 2,052 | Whiteside County | 44.3 | Normal | Employment & Wages |
| 56 | 2,064 | Madison County | 44.2 | Normal | Employment & Wages |
| 57 | 2,065 | Randolph County | 44.1 | Normal | Employment & Wages |
| 58 | 2,095 | Hancock County | 43.8 | Normal | Employment & Wages |
| 59 | 2,164 | Bureau County | 42.6 | Normal | Employment & Wages |
| 60 | 2,170 | Iroquois County | 42.6 | Normal | Employment & Wages |
| 61 | 2,188 | Bond County | 42.3 | Normal | Employment & Wages |
| 62 | 2,190 | Kane County | 42.3 | Normal | Housing Cost Burden |
| 63 | 2,200 | Clark County | 42.1 | Normal | Employment & Wages |
| 64 | 2,240 | Boone County | 41.6 | Normal | Employment & Wages |
| 65 | 2,286 | LaSalle County | 41.0 | Normal | Employment & Wages |
| 66 | 2,300 | Jersey County | 40.9 | Normal | Employment & Wages |
| 67 | 2,387 | Warren County | 39.4 | Normal | Employment & Wages |
| 68 | 2,392 | Menard County | 39.3 | Normal | Employment & Wages |
| 69 | 2,417 | Lee County | 38.8 | Normal | Employment & Wages |
| 70 | 2,419 | Scott County | 38.8 | Normal | Employment & Wages |
| 71 | 2,464 | Crawford County | 38.2 | Normal | Employment & Wages |
| 72 | 2,475 | Calhoun County | 38.1 | Normal | Employment & Wages |
| 73 | 2,506 | Ogle County | 37.6 | Normal | Employment & Wages |
| 74 | 2,510 | Marshall County | 37.6 | Normal | Employment & Wages |
| 75 | 2,513 | Sangamon County | 37.4 | Normal | Housing Cost Burden |
| 76 | 2,530 | Brown County | 37.1 | Normal | Employment & Wages |
| 77 | 2,539 | Ford County | 37.0 | Normal | Employment & Wages |
| 78 | 2,568 | Will County | 36.4 | Normal | Employment & Wages |
| 79 | 2,589 | Tazewell County | 36.0 | Normal | Employment & Wages |
| 80 | 2,598 | Grundy County | 35.8 | Normal | Employment & Wages |
| 81 | 2,607 | Livingston County | 35.7 | Normal | Employment & Wages |
| 82 | 2,613 | Douglas County | 35.7 | Normal | Community Vulnerability |
| 83 | 2,616 | Shelby County | 35.7 | Normal | Employment & Wages |
| 84 | 2,617 | Moultrie County | 35.6 | Normal | Community Vulnerability |
| 85 | 2,632 | Henry County | 35.4 | Normal | Employment & Wages |
| 86 | 2,640 | Mercer County | 35.3 | Normal | Employment & Wages |
| 87 | 2,658 | Kendall County | 34.8 | Healthy | Employment & Wages |
| 88 | 2,659 | McLean County | 34.8 | Healthy | Employment & Wages |
| 89 | 2,669 | Lake County | 34.6 | Healthy | Housing Cost Burden |
| 90 | 2,670 | Putnam County | 34.6 | Healthy | Employment & Wages |
| 91 | 2,719 | McHenry County | 33.7 | Healthy | Employment & Wages |
| 92 | 2,768 | Jo Daviess County | 32.8 | Healthy | Employment & Wages |
| 93 | 2,801 | Cumberland County | 32.0 | Healthy | Employment & Wages |
| 94 | 2,817 | De Witt County | 31.7 | Healthy | Employment & Wages |
| 95 | 2,824 | Effingham County | 31.6 | Healthy | Employment & Wages |
| 96 | 2,843 | Jasper County | 31.2 | Healthy | Employment & Wages |
| 97 | 2,858 | Clinton County | 30.9 | Healthy | Employment & Wages |
| 98 | 2,934 | DuPage County | 28.5 | Healthy | Housing Cost Burden |
| 99 | 2,938 | Piatt County | 28.5 | Healthy | Employment & Wages |
| 100 | 3,055 | Woodford County | 24.1 | Healthy | Employment & Wages |
| 101 | 3,058 | Washington County | 23.9 | Healthy | Employment & Wages |
| 102 | 3,086 | Monroe County | 22.2 | Healthy | Employment & Wages |
1 of 102 county reports for Illinois are currently available. All 102 counties are scored and visible on the map above. New county reports are published weekly.
How County Scores Work
Each county is scored 0–100 using percentile-rank averaging across five data domains: Debt & Delinquency, Income & Poverty, Housing Cost Burden, Employment & Wages, and Community Vulnerability. A score of 50 means the county falls at the national median. Higher scores indicate greater financial distress.