Idaho County Distress Index
Financial distress scores for all 44 counties in Idaho, scored 0–100 across five domains. Mean score: 43.4.
Data: Census, BLS, Urban Institute, HUD, US Courts | Scores as of 2026-03-17
Idaho Snapshot
Idaho County Map
Loading interactive map…
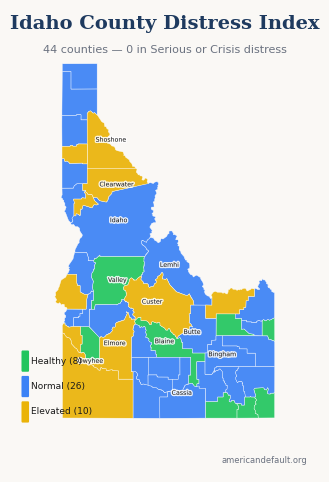
All 44 Idaho counties colored by distress zone. Hover for details; click released counties for full reports.
Most & Least Distressed
Most Distressed
Least Distressed
Score Distribution
How Idaho's 44 county scores are distributed across the 0–100 scale.
All Idaho Counties
44 counties ranked by distress score. Click column headers to sort.
| State Rank | Nat'l Rank | County | Score | Zone | Primary Driver |
|---|---|---|---|---|---|
| 1 | 502 | Shoshone County | 64.9 | Elevated | Community Vulnerability |
| 2 | 977 | Owyhee County | 58.1 | Elevated | Community Vulnerability |
| 3 | 1,028 | Washington County | 57.6 | Elevated | Housing Cost Burden |
| 4 | 1,117 | Clearwater County | 56.4 | Elevated | Community Vulnerability |
| 5 | 1,342 | Lewis County | 53.4 | Elevated | Community Vulnerability |
| 6 | 1,378 | Benewah County | 52.9 | Elevated | Community Vulnerability |
| 7 | 1,401 | Elmore County | 52.7 | Elevated | Community Vulnerability |
| 8 | 1,402 | Custer County | 52.7 | Elevated | Community Vulnerability |
| 9 | 1,502 | Canyon County | 51.1 | Elevated | Housing Cost Burden |
| 10 | 1,545 | Clark County | 50.6 | Elevated | Income & Poverty |
| 11 | 1,605 | Twin Falls County | 49.8 | Normal | Housing Cost Burden |
| 12 | 1,715 | Bannock County | 48.4 | Normal | Housing Cost Burden |
| 13 | 1,738 | Idaho County | 48.1 | Normal | Community Vulnerability |
| 14 | 1,788 | Gooding County | 47.5 | Normal | Community Vulnerability |
| 15 | 1,816 | Lemhi County | 47.1 | Normal | Community Vulnerability |
| 16 | 1,923 | Bonner County | 45.7 | Normal | Community Vulnerability |
| 17 | 1,938 | Nez Perce County | 45.5 | Normal | Housing Cost Burden |
| 18 | 1,948 | Jerome County | 45.4 | Normal | Community Vulnerability |
| 19 | 1,977 | Gem County | 45.1 | Normal | Community Vulnerability |
| 20 | 1,980 | Kootenai County | 45.1 | Normal | Housing Cost Burden |
| 21 | 2,005 | Adams County | 44.8 | Normal | Community Vulnerability |
| 22 | 2,047 | Lincoln County | 44.3 | Normal | Community Vulnerability |
| 23 | 2,084 | Madison County | 43.9 | Normal | Housing Cost Burden |
| 24 | 2,189 | Payette County | 42.3 | Normal | Community Vulnerability |
| 25 | 2,191 | Butte County | 42.3 | Normal | Income & Poverty |
| 26 | 2,264 | Boise County | 41.4 | Normal | Employment & Wages |
| 27 | 2,274 | Fremont County | 41.2 | Normal | Community Vulnerability |
| 28 | 2,288 | Boundary County | 41.0 | Normal | Community Vulnerability |
| 29 | 2,294 | Latah County | 40.9 | Normal | Housing Cost Burden |
| 30 | 2,318 | Cassia County | 40.5 | Normal | Community Vulnerability |
| 31 | 2,342 | Minidoka County | 40.1 | Normal | Community Vulnerability |
| 32 | 2,352 | Power County | 40.0 | Normal | Community Vulnerability |
| 33 | 2,402 | Bonneville County | 39.1 | Normal | Housing Cost Burden |
| 34 | 2,494 | Camas County | 37.8 | Normal | Community Vulnerability |
| 35 | 2,514 | Caribou County | 37.4 | Normal | Housing Cost Burden |
| 36 | 2,631 | Bingham County | 35.4 | Normal | Community Vulnerability |
| 37 | 2,699 | Bear Lake County | 34.0 | Healthy | Community Vulnerability |
| 38 | 2,795 | Ada County | 32.1 | Healthy | Housing Cost Burden |
| 39 | 2,829 | Teton County | 31.5 | Healthy | Housing Cost Burden |
| 40 | 2,837 | Franklin County | 31.4 | Healthy | Community Vulnerability |
| 41 | 2,868 | Oneida County | 30.5 | Healthy | Employment & Wages |
| 42 | 2,966 | Jefferson County | 27.6 | Healthy | Employment & Wages |
| 43 | 2,977 | Valley County | 27.2 | Healthy | Employment & Wages |
| 44 | 3,000 | Blaine County | 26.5 | Healthy | Community Vulnerability |
0 of 44 county reports for Idaho are currently available. All 44 counties are scored and visible on the map above. New county reports are published weekly.
How County Scores Work
Each county is scored 0–100 using percentile-rank averaging across five data domains: Debt & Delinquency, Income & Poverty, Housing Cost Burden, Employment & Wages, and Community Vulnerability. A score of 50 means the county falls at the national median. Higher scores indicate greater financial distress.