Colorado County Distress Index
Financial distress scores for all 64 counties in Colorado, scored 0–100 across five domains. Mean score: 43.8. 4counties are in Serious Stress or Crisis.
Data: Census, BLS, Urban Institute, HUD, US Courts | Scores as of 2026-03-17
Colorado Snapshot
Colorado County Map
Loading interactive map…
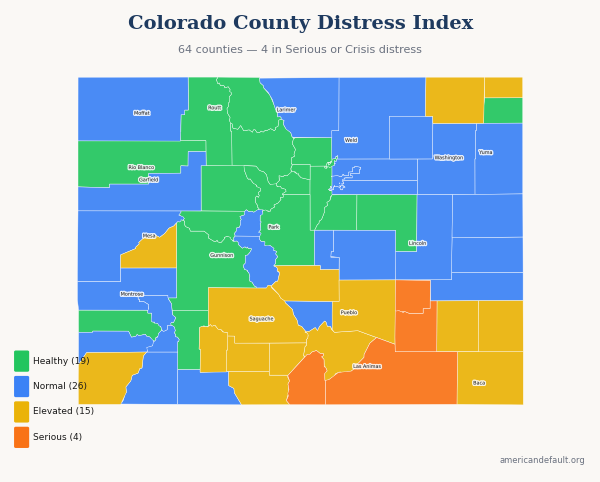
All 64 Colorado counties colored by distress zone. Hover for details; click released counties for full reports.
Most & Least Distressed
Most Distressed
Least Distressed
Score Distribution
How Colorado's 64 county scores are distributed across the 0–100 scale.
All Colorado Counties
64 counties ranked by distress score. Click column headers to sort.
| State Rank | Nat'l Rank | County | Score | Zone | Primary Driver |
|---|---|---|---|---|---|
| 1 | 210 | Costilla County | 70.1 | Serious Stress | Income & Poverty |
| 2 | 322 | Las Animas County | 67.8 | Serious Stress | Income & Poverty |
| 3 | 492 | Otero County | 65.1 | Serious Stress | Income & Poverty |
| 4 | 495 | Crowley County | 65.0 | Serious Stress | Income & Poverty |
| 5 | 612 | Bent County | 63.1 | Elevated | Income & Poverty |
| 6 | 682 | Pueblo County | 62.1 | Elevated | Housing Cost Burden |
| 7 | 789 | Alamosa County | 60.6 | Elevated | Income & Poverty |
| 8 | 806 | Rio Grande County | 60.4 | Elevated | Income & Poverty |
| 9 | 818 | Prowers County | 60.2 | Elevated | Income & Poverty |
| 10 | 921 | Conejos County | 58.7 | Elevated | Income & Poverty |
| 11 | 941 | Delta County | 58.5 | Elevated | Housing Cost Burden |
| 12 | 952 | Saguache County | 58.4 | Elevated | Income & Poverty |
| 13 | 1,000 | Montezuma County | 57.9 | Elevated | Income & Poverty |
| 14 | 1,009 | Fremont County | 57.8 | Elevated | Income & Poverty |
| 15 | 1,025 | Sedgwick County | 57.6 | Elevated | Income & Poverty |
| 16 | 1,215 | Huerfano County | 55.0 | Elevated | Income & Poverty |
| 17 | 1,310 | Mineral County | 53.7 | Elevated | Housing Cost Burden |
| 18 | 1,444 | Baca County | 52.2 | Elevated | Income & Poverty |
| 19 | 1,521 | Logan County | 50.9 | Elevated | Income & Poverty |
| 20 | 1,606 | Lincoln County | 49.8 | Normal | Income & Poverty |
| 21 | 1,611 | Adams County | 49.8 | Normal | Housing Cost Burden |
| 22 | 1,664 | Mesa County | 49.1 | Normal | Housing Cost Burden |
| 23 | 1,736 | Kit Carson County | 48.1 | Normal | Community Vulnerability |
| 24 | 1,956 | Morgan County | 45.3 | Normal | Housing Cost Burden |
| 25 | 2,022 | Arapahoe County | 44.6 | Normal | Housing Cost Burden |
| 26 | 2,063 | Montrose County | 44.2 | Normal | Housing Cost Burden |
| 27 | 2,078 | Archuleta County | 44.0 | Normal | Community Vulnerability |
| 28 | 2,136 | San Juan County | 43.2 | Normal | Employment & Wages |
| 29 | 2,159 | Denver County | 42.7 | Normal | Housing Cost Burden |
| 30 | 2,197 | El Paso County | 42.2 | Normal | Housing Cost Burden |
| 31 | 2,203 | Dolores County | 42.1 | Normal | Employment & Wages |
| 32 | 2,213 | Washington County | 42.0 | Normal | Income & Poverty |
| 33 | 2,235 | Weld County | 41.6 | Normal | Housing Cost Burden |
| 34 | 2,317 | Moffat County | 40.5 | Normal | Community Vulnerability |
| 35 | 2,326 | Lake County | 40.3 | Normal | Housing Cost Burden |
| 36 | 2,358 | Yuma County | 39.9 | Normal | Income & Poverty |
| 37 | 2,370 | La Plata County | 39.6 | Normal | Housing Cost Burden |
| 38 | 2,384 | Kiowa County | 39.4 | Normal | Income & Poverty |
| 39 | 2,485 | Garfield County | 37.9 | Normal | Housing Cost Burden |
| 40 | 2,518 | Teller County | 37.3 | Normal | Housing Cost Burden |
| 41 | 2,536 | Ouray County | 37.0 | Normal | Community Vulnerability |
| 42 | 2,542 | Custer County | 36.9 | Normal | Income & Poverty |
| 43 | 2,570 | Larimer County | 36.4 | Normal | Housing Cost Burden |
| 44 | 2,588 | Chaffee County | 36.0 | Normal | Housing Cost Burden |
| 45 | 2,651 | Cheyenne County | 35.0 | Normal | Income & Poverty |
| 46 | 2,665 | Gilpin County | 34.7 | Healthy | Housing Cost Burden |
| 47 | 2,687 | San Miguel County | 34.2 | Healthy | Housing Cost Burden |
| 48 | 2,691 | Phillips County | 34.1 | Healthy | Income & Poverty |
| 49 | 2,701 | Hinsdale County | 34.0 | Healthy | Employment & Wages |
| 50 | 2,716 | Clear Creek County | 33.7 | Healthy | Housing Cost Burden |
| 51 | 2,718 | Eagle County | 33.7 | Healthy | Housing Cost Burden |
| 52 | 2,737 | Grand County | 33.4 | Healthy | Housing Cost Burden |
| 53 | 2,739 | Jefferson County | 33.3 | Healthy | Housing Cost Burden |
| 54 | 2,751 | Gunnison County | 33.1 | Healthy | Housing Cost Burden |
| 55 | 2,797 | Rio Blanco County | 32.1 | Healthy | Community Vulnerability |
| 56 | 2,835 | Boulder County | 31.4 | Healthy | Housing Cost Burden |
| 57 | 2,842 | Park County | 31.3 | Healthy | Housing Cost Burden |
| 58 | 2,852 | Summit County | 31.0 | Healthy | Housing Cost Burden |
| 59 | 2,871 | Jackson County | 30.5 | Healthy | Housing Cost Burden |
| 60 | 2,902 | Routt County | 29.5 | Healthy | Housing Cost Burden |
| 61 | 3,042 | Broomfield County | 24.6 | Healthy | Housing Cost Burden |
| 62 | 3,044 | Pitkin County | 24.5 | Healthy | Housing Cost Burden |
| 63 | 3,067 | Elbert County | 23.4 | Healthy | Housing Cost Burden |
| 64 | 3,069 | Douglas County | 23.2 | Healthy | Housing Cost Burden |
0 of 64 county reports for Colorado are currently available. All 64 counties are scored and visible on the map above. New county reports are published weekly.
How County Scores Work
Each county is scored 0–100 using percentile-rank averaging across five data domains: Debt & Delinquency, Income & Poverty, Housing Cost Burden, Employment & Wages, and Community Vulnerability. A score of 50 means the county falls at the national median. Higher scores indicate greater financial distress.