The Irrigation Yakima County, Washington
Yakima County produces $2.3 billion in crops on Bureau of Reclamation water and sustains its workforce on Medicaid, SNAP, and a federally qualified health center network. Both irrigation systems are external. Both are politically vulnerable.

Behind on your mortgage or facing eviction? Take a 2-minute assessment to see your options.
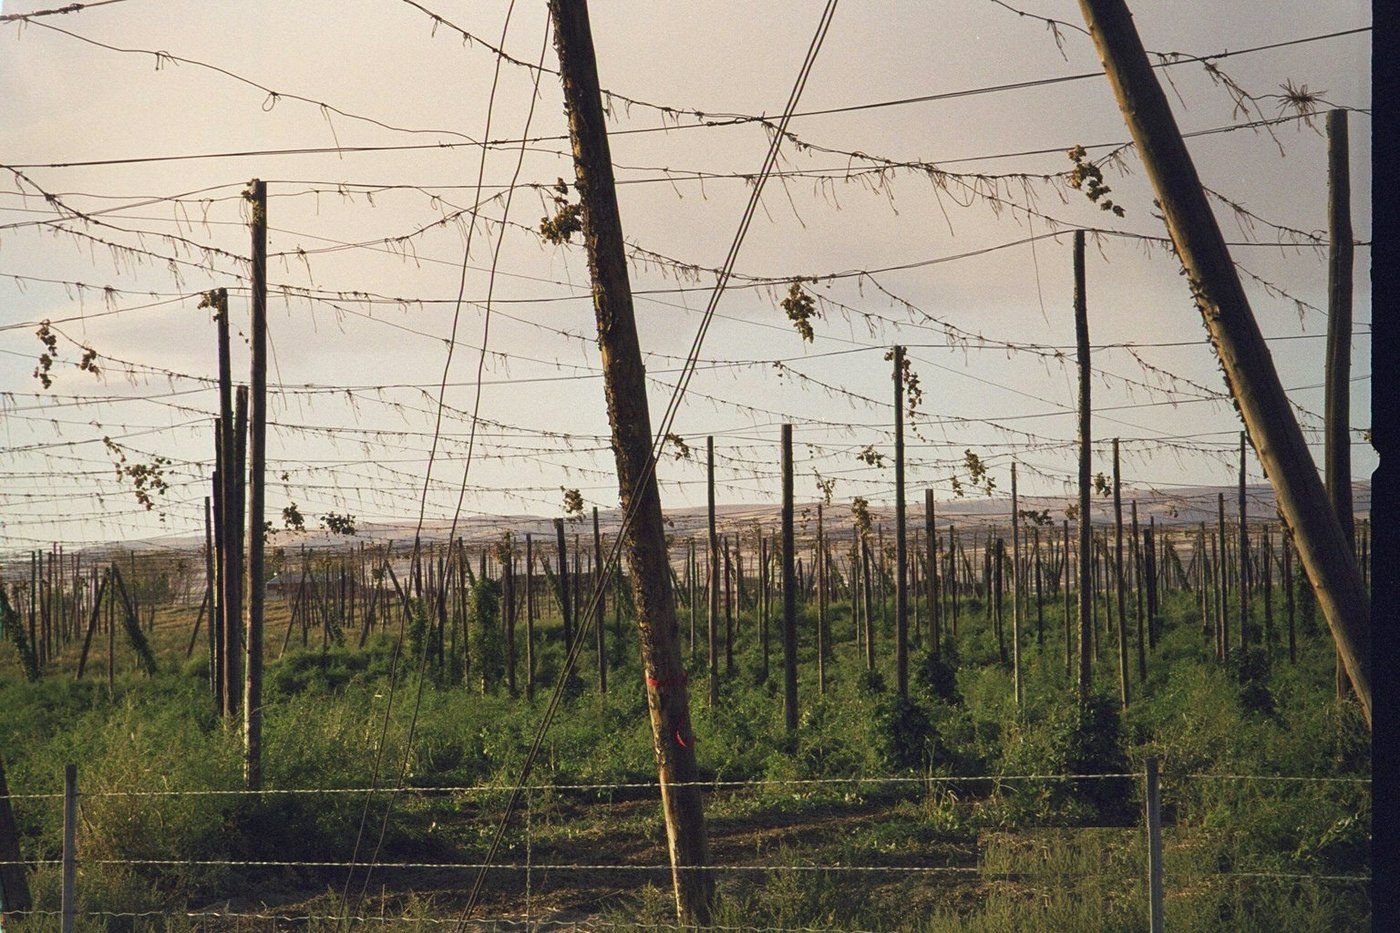
Drive east from Seattle on I-90 and the state splits in two. You cross Snoqualmie Pass, drop through the Cascades, and the rain disappears. Western Washington gets 37 inches a year. The Yakima Valley gets eight. The landscape empties into sagebrush and basalt, and then — abruptly — orchards. Apple trees in rows so precise they look industrial. Hop trellises running to the horizon. Vineyards climbing hillsides that haven't seen natural rain in months.
None of it should be here. The valley floor is high desert. What you're looking at is infrastructure — 72,000 acres opened by the Roza Canal in 1945, another 150,000 irrigated through the Wapato Project on the Yakama Reservation. Bureau of Reclamation water turning eight inches of rainfall into $2.3 billion in annual farm sales (2022 USDA Census).
The phrase locals use is "the Cascade Curtain." It works both ways. King County, on the other side, is the least distressed county in Washington — Amazon, Microsoft, tech salaries cushioning every metric. Yakima, on this side, is the most distressed. They share a border along the Cascade crest. Same state, same governor.
Yakima County is the leading apple-producing county in the nation. More than 55,000 acres of orchards. Nearly 19,000 acres of hops. Nearly 19,000 acres of wine grapes across more than 90 wineries. Eight thousand acres of pears. The hop fields alone produce 75% of the American crop — in 2015 and 2016, the Yakima Valley outproduced Germany.
The agricultural workforce — 29,212 jobs, the county's largest sector — generates $1.16 billion in annual wages (2024) for output worth twice that. Elizabeth McGree, whose family has farmed hops at Morrier Ranch since 1915, puts it simply: "You have people coming from every other part of the world because they want American hops."
The people who grow them are a different story. Yakima County is 54% Hispanic, up from 14% in 1980. The demographic shift tracks agricultural labor migration across a single generation. An estimated 24,000 residents — roughly 9% of the county — are undocumented. The county's economy runs on labor that its own immigration system treats as illegal. The orchards need irrigated water. They also need irrigated labor. Both arrive from somewhere else.
The unemployment rate tells a story that annual averages obscure. In September 2025, at harvest peak, unemployment was 4.2%. By December, when the orchards are bare and the hop bines are cut, it hit 7.2%. A three-percentage-point swing in a single season.
The CDI reads unemployment at the 96th percentile — worse than 96.8% of American counties. That number is the annual average, which means it captures a structural feature of seasonal agriculture rather than a permanent labor market failure. I've been uncertain about this in other agricultural counties, and Yakima makes the question sharper: is 96th-percentile unemployment in a county with a 4.2% harvest-season rate a distress signal or a measurement artifact? The answer, I think, is both. The seasonal swing means that thousands of workers cycle through months without income every year. The CDI's Employment & Wages domain — 81.2 out of 100 — isn't wrong. It's capturing the gap between working September and surviving January.
In August 1939, the Farm Security Administration sent Dorothea Lange to photograph migrant workers in this valley — a mother picking pears at 30 cents an hour in 106-degree heat. The FSA built labor camps at Ahtanum and Crewport, direct siblings of the Weedpatch camp near Bakersfield that Steinbeck put in The Grapes of Wrath. Same federal program, same plywood architecture, same mission: give the people who harvest the crop a place to sleep. Eighty-six years later, the county provides approximately 4,600 beds of seasonal farmworker housing for over 45,000 seasonal jobs. The ratio hasn't improved.
The 2025 harvest added a new pressure. ICE arrests in Washington surged to 1,044 by September, up from 976 in all of 2024. Voluntary departures jumped from 592 in February to 4,241 in July. Edgar Franks, political director of Familias Unidas por la Justicia, described the effect: "There's been more reluctance for people to feel free, to move around and look for work." The nation lost 155,000 agricultural workers between March and July 2025 — roughly a 7% decline. The early apple harvest came in 5.6 million boxes short of forecast, driven by August heat and selective picking in a season when labor availability was already in question. The labor supply was irrigated too. Now it's being cut.
More than 130,000 Yakima County residents — 50% of the county's population — are enrolled in Medicaid. Nearly 87% of children under 19 are covered. The hospitals depend on it: Medicaid represents 25% to 36.9% of gross revenues across the county's hospital system. At Astria Toppenish Hospital, on the Yakama Reservation, the Medicaid share of admissions is even higher.
Then there's the number that I haven't encountered anywhere else in 15 county profiles. Medical debt in collections: 0.0%. Nationally the median is 3.7%. Yakima registers zero. The county is 13% uninsured, which would normally produce measurable medical collections. But the safety net intercepts the debt before it forms. The Yakima Valley Farm Workers Clinic — founded in 1978 in a plywood house built by VISTA volunteers in Toppenish — now serves over 200,000 patients annually with sliding-fee scales. SNAP enrollment sits at the 91st percentile nationally. One in five tax filers claims the Earned Income Tax Credit. Transfer payments account for 27.9% of all personal income in the county.
Eight inches of annual rainfall. Without the Roza Canal, no orchards. Wages that barely clear the national median. Without Medicaid and the FQHC network, the workers who pick those orchards can't afford to stay alive in the place where they work.
Yakima's CDI profile is inverted from most distressed counties I've written. The usual pattern is debt-led — high delinquency, high collections, households that borrowed and fell behind. Yakima's Debt & Delinquency domain scores 43.2. Normal. Below the national median. Auto loans, student loans, medical debt — all below average.
The distress is upstream. Employment & Wages: 81.2. Housing Cost Burden: 76.0. Income & Poverty: 66.5. The county's workers earn roughly median wages when they're working, but far more people lack work than almost anywhere in the country. The homeownership rate is 62.4% — only 10.7% of counties have a lower rate. Among owners, 29.3% spend more than 30% of income on housing, an 87th-percentile burden. The median home costs roughly $350,000 (ACS 2023), which wouldn't be alarming in Seattle. Against Yakima's income base, it is.
The debt domain hasn't caught up. Whether it does depends on what happens to the two irrigation systems. As of early 2026, Congress is debating Medicaid cuts that could strip coverage from 31,693 people in the congressional district alone. Julia Barcott of the Washington State Nurses Association described what that means: "Patients will put off getting care until their conditions are far more serious and harder to treat."
The counterpoint is real. Business formation has surged 66% since 2019 — 2,328 new applications in 2024, up from 1,402. The YVFWC has grown from a single clinic in Toppenish into a 2,000-employee healthcare network. Graduation rates in the Yakima School District have climbed from 73% to 82% over five years. The county is not a story of uninterrupted decline. The system works as long as the water keeps flowing.
The Treaty of 1855 ceded 12 million acres of Yakama land and reserved fishing rights to what was once a run of an estimated 16 million salmon. Today the basin would be fortunate to see 2 million return. The same infrastructure that built the valley's agricultural economy — the canals, the diversions, the dams — made the treaty's promise structurally impossible to keep. Irrigation always costs someone. The indicators to watch are Employment & Wages, already at 81.2, and the Debt & Delinquency domain that sits at 43.2 like a pressure gauge still reading normal while the system upstream strains. If either irrigation system contracts — if the water rights tighten or the Medicaid enrollment drops — the 33-point gap between this county and the one on the other side of the mountains is going to widen. The crop will still grow. The question is whether the people who harvest it can still afford to be here.
The Numbers Behind the Score
The CDI measures five domains of household financial distress. Yakima's profile is unusual: Employment & Wages dominates at 81.2, driven by 96th-percentile unemployment and a wage-to-rent ratio in the bottom 16% nationally. Housing Cost Burden follows at 76.0. Debt & Delinquency, the domain that leads in most distressed counties, scores just 43.2 here — Normal. The distress is upstream of the borrowing.
Scores are percentile-based: 50 = national median, higher = more distressed. The median line is shown on each bar.
Neighbors and Peers
Yakima scores higher than all eight of its adjacent counties. The closest is Lewis County at 56.8 (Elevated), nearly 8 points lower. The most striking gap is with King County (Seattle) at 31.8 — the most and least distressed counties in Washington share a border along the Cascade crest, 33 points apart.
Neighboring Counties
| County | Score | Zone | vs. Yakima County |
|---|---|---|---|
| Yakima County, WA | 64.5 | Elevated | — |
| Lewis County, WA | 56.8 | Elevated | -7.8 |
| Grant County, WA | 55.5 | Elevated | -9.0 |
| Kittitas County, WA | 50.7 | Elevated | -13.8 |
| Pierce County, WA | 47.1 | Normal | -17.4 |
| Klickitat County, WA | 46.5 | Normal | -18.1 |
| Benton County, WA | 45.3 | Normal | -19.2 |
| Skamania County, WA | 40.9 | Normal | -23.6 |
| King County, WA | 31.8 | Healthy | -32.8 |
Population Peers
| County | Score | Zone | vs. Yakima County |
|---|---|---|---|
| Passaic County, NJ | 64.7 | Elevated | +0.2 |
| Lubbock County, TX | 63.7 | Elevated | -0.9 |
| Shelby County, TN | 65.5 | Serious | +1.0 |
| Chatham County, GA | 65.5 | Serious | +1.0 |
| Atlantic County, NJ | 63.5 | Elevated | -1.1 |
Key Metrics
For researchers and journalists. All data from the County Distress Index unless noted.
| Metric | Value | Source |
|---|---|---|
| County Distress Index score | 64.5 / 100 (Elevated) | CDI |
| Employment & Wages domain | 81.2 / 100 (96th-percentile unemployment) | CDI |
| Annual farm sales | $2.3 billion (2022 Census of Agriculture) | USDA via WA ESD |
| Medicaid enrollment | 130,000+ residents (50% of population) | WSNA / WA Health Care Authority |
| Medical debt in collections | 0.0% (national median 3.7%) | Urban Institute via CDI |
| Seasonal unemployment swing | 4.2% (Sept) to 7.2% (Dec 2025) | WA Employment Security Dept |
| Hispanic population share | 54% (up from 14% in 1980) | Census Bureau |
Suggested citations:
"Yakima County scores 64.5 on the County Distress Index — the most distressed county in Washington state. Its Employment & Wages domain reads 81.2 while Debt & Delinquency sits at 43.2, an inversion from the usual distress pattern where households borrow first and fall behind later." — American Default Research, 2026.
"Half of Yakima County's population is enrolled in Medicaid. Medical debt in collections registers at 0.0% — the safety net intercepts the debt before it forms. The question is what happens to that 0.0% if 31,693 people in the congressional district lose Medicaid coverage." — American Default Research, 2026.
Download Data
Export all distress indicators for Yakima County as a CSV file.
Find Help in Yakima County
HUD-Approved Housing Counselors
Free foreclosure prevention and financial counseling near Yakima County.
Find an Attorney
Washington State Bar Association — Find Legal Help offers a lawyer referral service for bankruptcy, foreclosure defense, and consumer rights.
Free Legal Aid
Legal aid organizations serving Yakima County residents at no cost.
Self-Help Resources
American Default Research does not endorse, rate, or rank any provider. Verify attorney credentials with your state bar.