Dearborn County, Indiana
Above the national median for auto loan delinquency.
Main Findings
Dearborn County, Indiana ranks 2,024th most distressed in the United States on the County Distress Index. Dearborn sits near the national median across major distress indicators.
- 2,024th of 3,144 counties on the County Distress Index — Normal zone, 65th in Indiana.
- 6% of auto loan accounts are 60+ days past due (U.S. median 5%). Auto loan delinquency at the 63rd percentile nationally.
- Bankruptcy filing rate at 193 — national median 126, ranked at the 73rd percentile.
- Wage-to-rent ratio at 3.1× — national median 4.0×, ranked at the 85th percentile.
- Owner housing burden at 27% — national median 24%, ranked at the 72nd percentile.
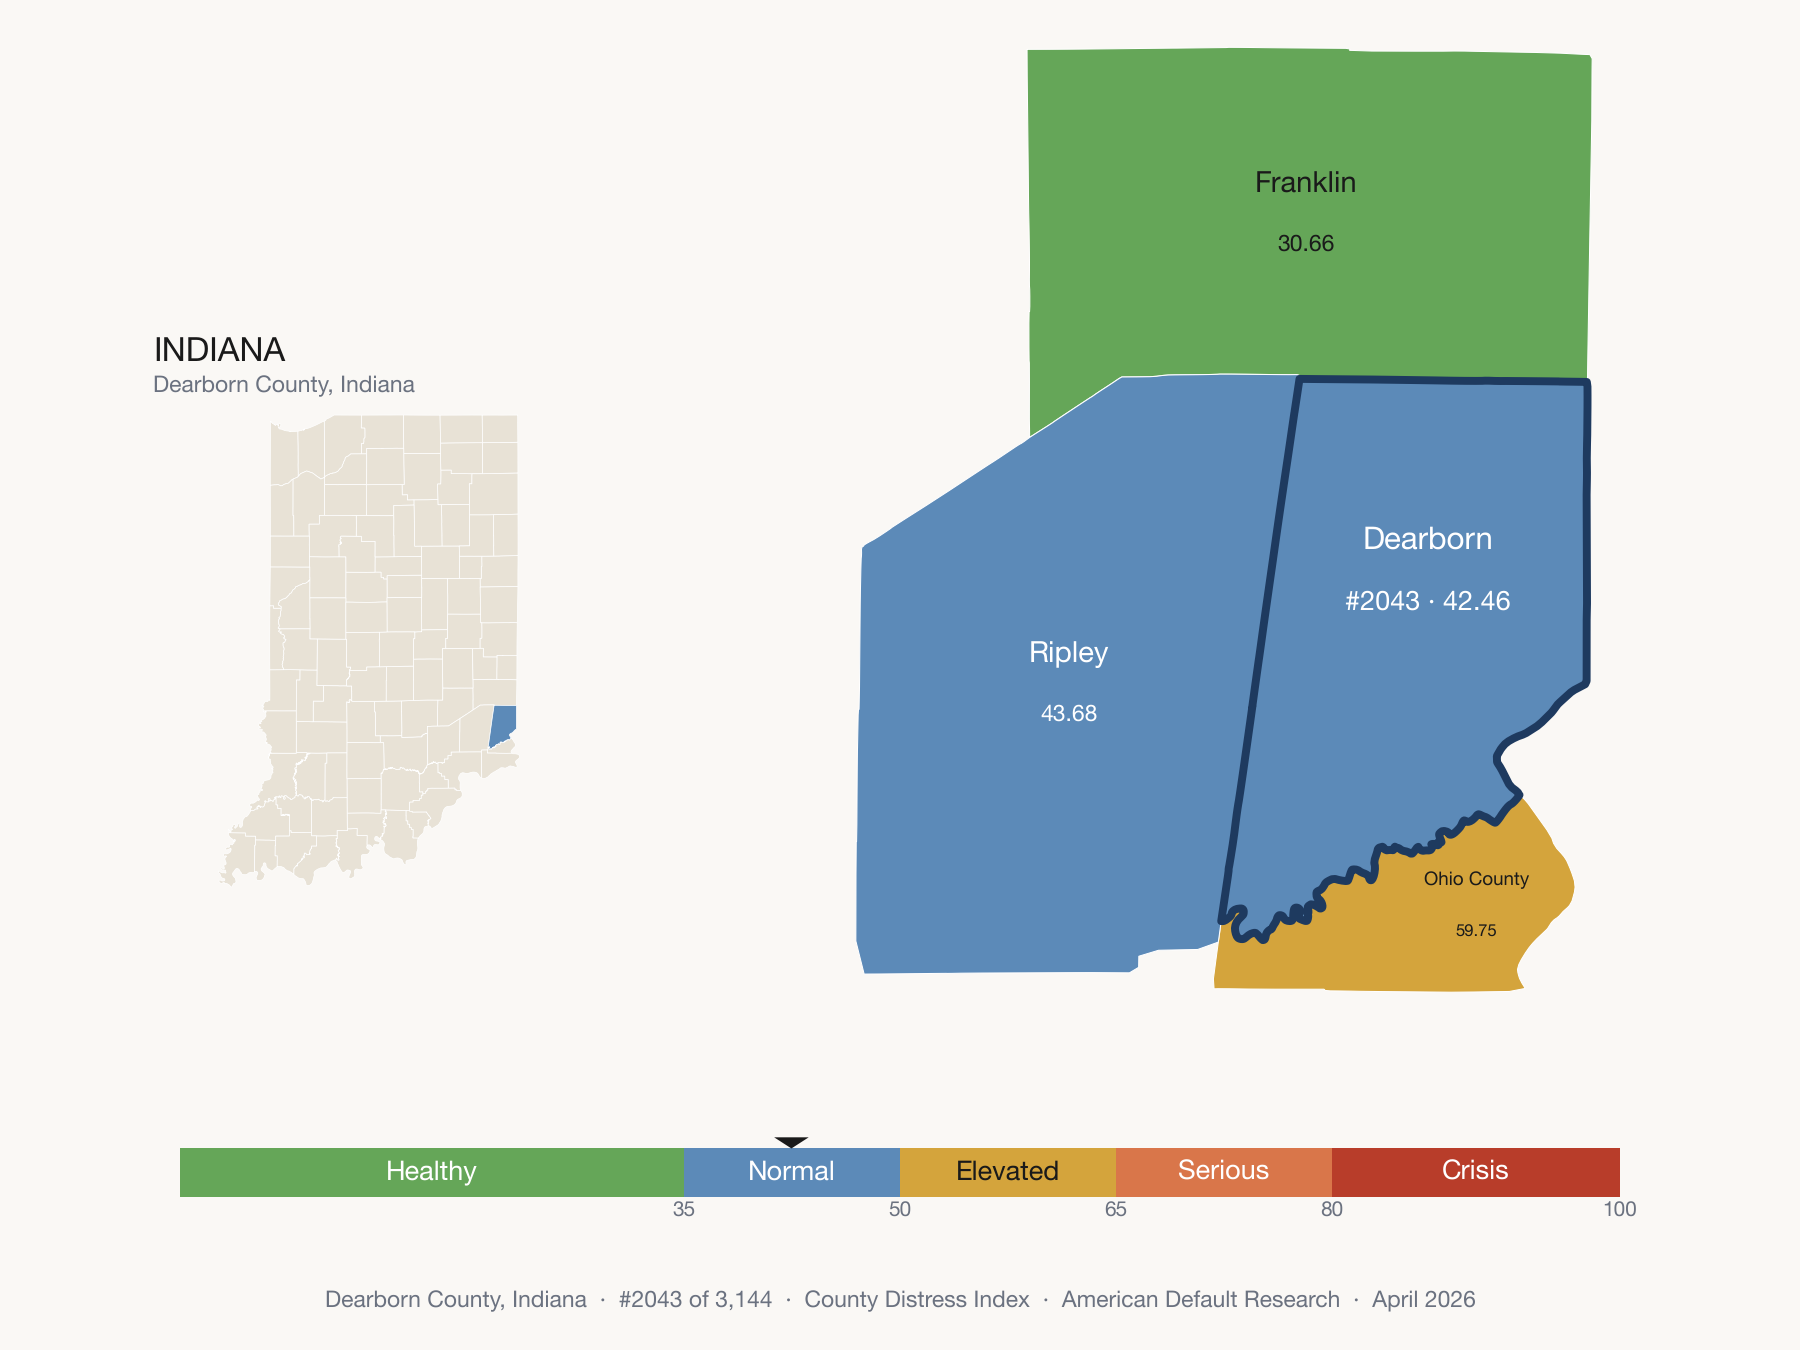
Neighbors span three CDI zones. The 29-point drop to Franklin County marks where the Indiana distress corridor ends.
"Dearborn County sits at the national median. The composition of its distress matters more than the composite score."
"Normal-zone counties are the national median. The interesting signal here is which domain is moving fastest, up or down."
The Indicators Behind Dearborn County's CDI Score
Every number traces to a public source. Dearborn County's value shown alongside IN's median and the U.S. median. Full CSV available for download.
| Indicator | Dearborn | IN median | U.S. median | Pctile | Source |
|---|---|---|---|---|---|
| Consumer Credit Distress — domain score 42 · Rank 1,829 of 3,144 | |||||
| Debt in collections Share of residents with a credit file who have debt in collections | 20% | 22% | 23% | 40th | Urban Institute (2024) |
| Medical debt in collections Share of residents with a credit file who have medical debt in collections | 4% | 4% | 4% | 52nd | Urban Institute (2024) |
| Auto loan delinquency Share of auto loan accounts 60+ days past due | 6% | 5% | 5% | 63rd | Urban Institute (2024) |
| Credit card delinquency Share of credit card accounts 60+ days past due | 4% | 5% | 5% | 32nd | Urban Institute (2024) |
| Uninsured rate Share of residents without health insurance coverage | 5% | 7% | 8% | 15th | Census ACS 5-yr (2023) |
| Subprime credit share Share of residents with a credit score below 660 | 21% | 23% | 23% | 39th | Urban Institute (2024) |
| Housing Cost Burden — domain score 38 · Rank 2,019 of 3,144 | |||||
| Rent burden (30%+) Share of renter households paying 30%+ of income on rent | 35% | 37% | 38% | 40th | Census ACS 5-yr (2023) |
| Severe rent burden (50%+) Share of renter households paying 50%+ of income on rent | 17% | 16% | 18% | 42nd | Census ACS 5-yr (2023) |
| Owner housing burden Share of owner households paying 30%+ of income on housing | 27% | 23% | 24% | 72nd | Census ACS 5-yr (2023) |
| Homeownership rate Share of occupied housing units that are owner-occupied | 85% | 76% | 74% | 4th | Census ACS 5-yr (2023) |
| Structural Poverty — domain score 20 · Rank 2,741 of 3,144 | |||||
| Unemployment Share of labor force unemployed | 4% | 4% | 4% | 25th | BLS LAUS (Dec 2025) |
| Poverty rate Share of population below the federal poverty line | 8% | 11% | 14% | 7th | Census SAIPE (2023) |
| Household income relative to state Median household income as share of state median | 1.24× | 1.00× | 1.00× | 14th | Census SAIPE (2023) |
| Child poverty rate Share of children under 18 below the federal poverty line | 9% | 14% | 18% | 9th | Census SAIPE (2023) |
| Disability rate Share of residents reporting a disability | 14% | 15% | 16% | 37th | Census ACS 5-yr (2023) |
| Transfer-income dependency Share of personal income from government transfers | 22% | 25% | 27% | 28th | BEA Regional Personal Income (2023) |
| Legal Distress — domain score 73 · Rank 852 of 3,144 | |||||
| Bankruptcy filing rate Personal bankruptcy filings per 100,000 residents | 193 | 223 | 126 | 73rd | US Courts F-5A (2025) |
| Economic Vitality — domain score 65 · Rank 725 of 3,144 | |||||
| Wage-to-rent ratio Ratio of average weekly wage to fair-market rent | 3.1× | 4.2× | 4.0× | 85th | BLS QCEW × HUD FMR (2024) |
| Rent-to-income ratio Fair Market Rent (2BR) as share of median household income | 20% | 19% | 21% | 35th | HUD FMR × Census ACS (2024) |
| Business formation rate New business applications per 1,000 residents | 8.6 | 8.9 | 10.0 | 70th | Census Business Formation Statistics (2024) |
| House price change (yoy) House price index year-over-year change | 4% | 5% | 4% | 47th | FHFA HPI (2024) |
Five-Domain Breakdown
The CDI is a PCA-weighted composite of five statistically derived factors. Weights are proportional to each factor's share of explained variance across 3,144 counties.
Methodology
The County Distress Index is a 0–100 composite score of household financial distress, computed for all 3,144 U.S. counties. A score of 50 represents the national county median; higher scores indicate greater distress. The index is built from 21 indicators grouped into five statistically derived factors via principal component analysis (PCA); factor weights are proportional to each factor's share of explained variance (shown in the Five-Domain Breakdown above).
Data sources include the Urban Institute Debt in America (Equifax consumer credit panel), U.S. Census Bureau (American Community Survey 5-year, Small Area Income and Poverty Estimates, Business Formation Statistics), Bureau of Labor Statistics (Local Area Unemployment Statistics, Quarterly Census of Employment and Wages), U.S. Courts Administrative Office (F-5A bankruptcy filings), and HUD Fair Market Rents. Data vintages range from 2023 to 2025 depending on source; full indicator-level vintage detail is in the methodology document.
For Press & Research
Everything you need to cite Dearborn County data — in under 60 seconds.
Draft wire copy 136-word AP-style article — use freely with attribution
LAWRENCEBURG, Ind. — Dearborn County ranks 2,024th among the nation's most financially distressed counties, according to the County Distress Index released this month by American Default Research.
The composite score of 43 out of 100 places Dearborn in the "Normal" zone. Among 3,144 U.S. counties scored, 2,023 counties rank more distressed. Within Indiana, Dearborn ranks 65th of 92 counties.
The index, which draws on 21 indicators from the U.S. Census Bureau, Bureau of Labor Statistics, Urban Institute and federal court filings, finds Dearborn sitting near the national median across major distress indicators, with no single domain emerging as a clear driver.
"Dearborn County sits at the national median. The composition of its distress matters more than the composite score," said Ross Kilburn, founder of American Default Research.
Full methodology and county-by-county data are available at americandefault.org/methodology/cdi.
Frequently Asked Questions
What is Dearborn County's CDI score, and what does it mean?
What drives Dearborn County's distress score?
How does Dearborn County compare to its neighbors?
How is the County Distress Index calculated?

Dearborn County resident looking for help? HUD counselors, legal aid, and attorney referrals →