American Default 

Reveal opportunity. Spot risk. Invest like a pro.
A report on one county’s household debt, rents and unemployment, made for investors, lenders and agents. Its tables set the county beside the state and U.S. figures where those exist, and every number has its source.
See what you get
-
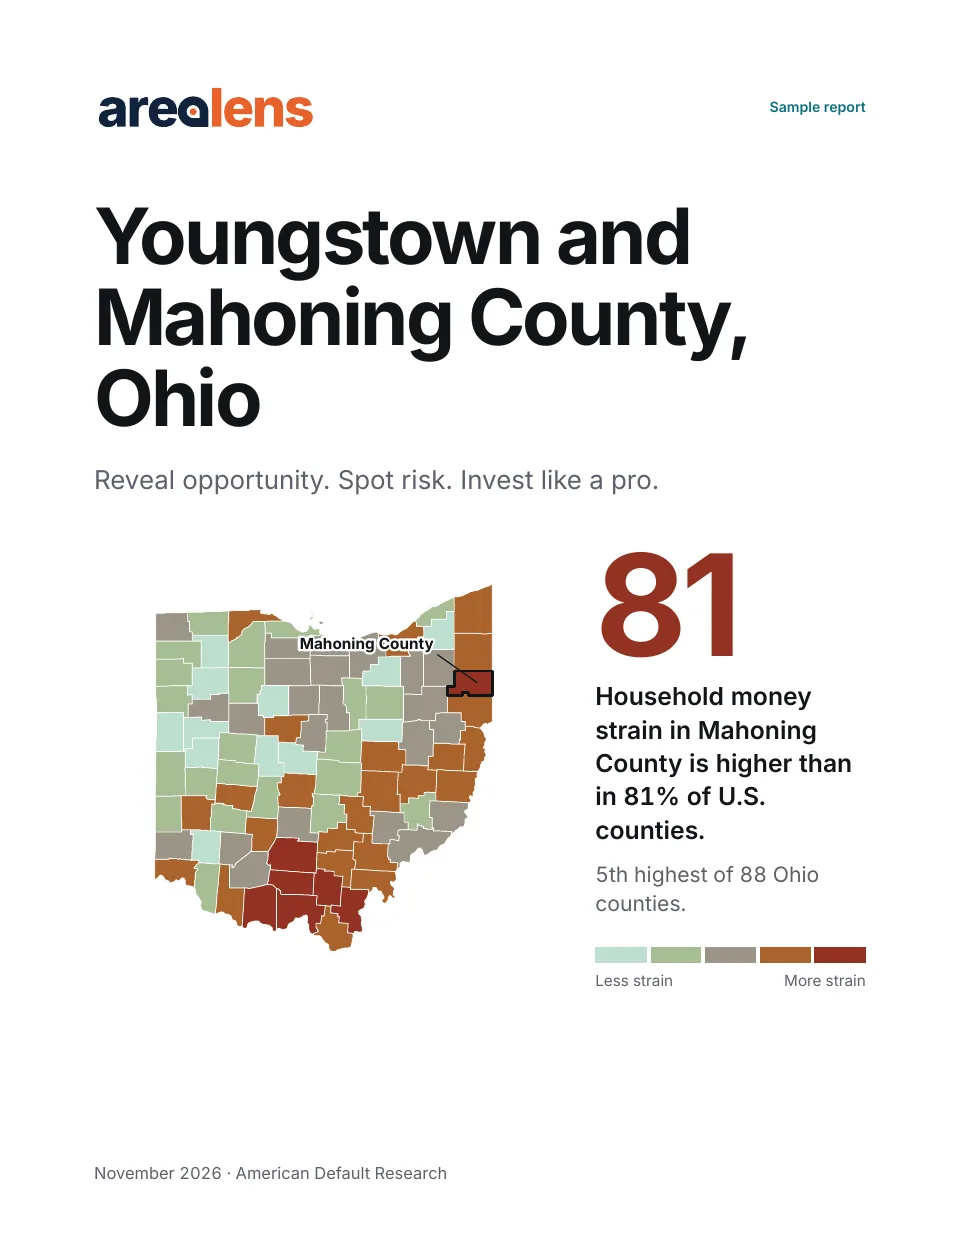 The cover
-
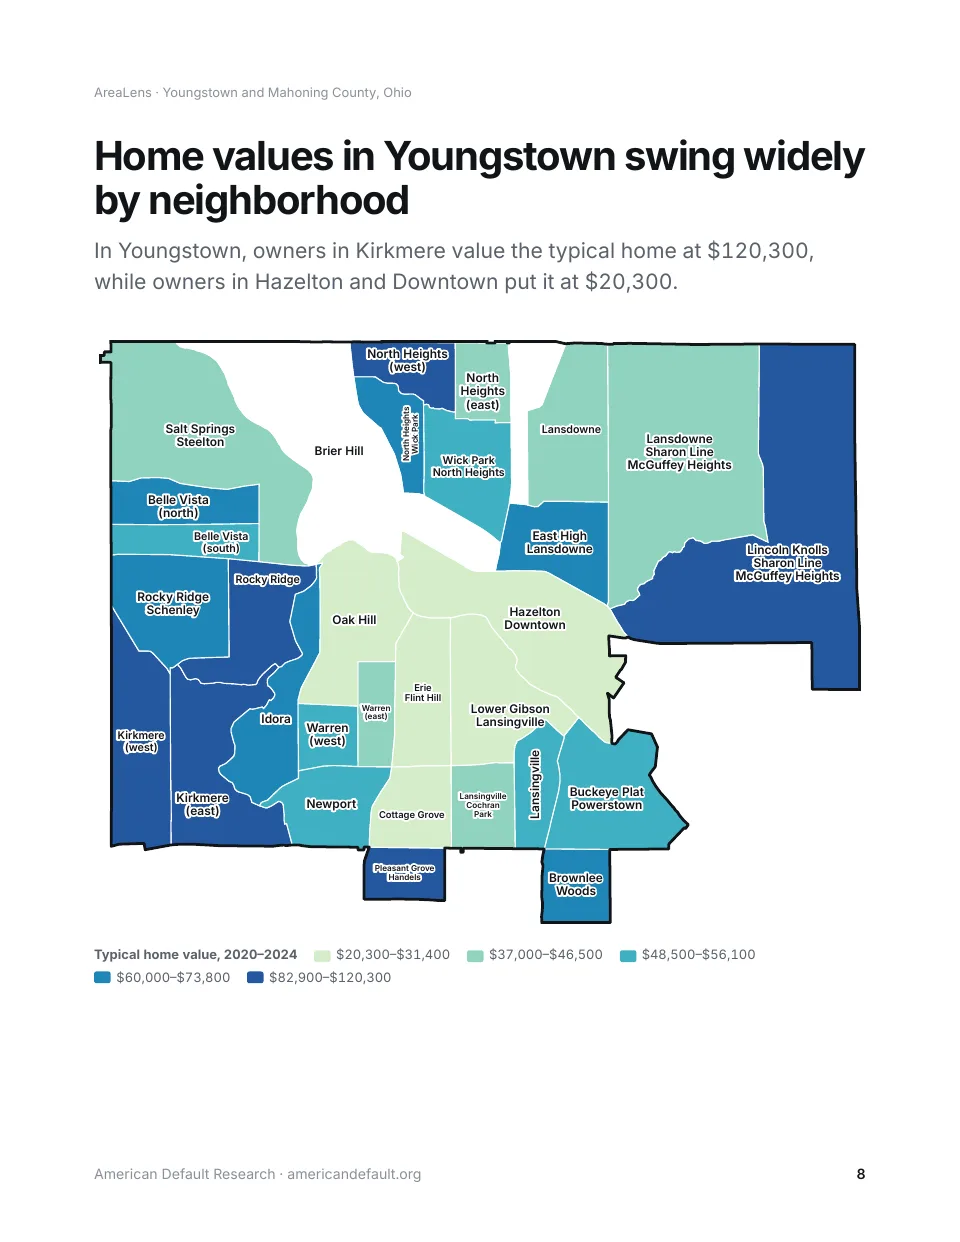 The town map
What’s in a report
It opens with what a buyer asks first about the town you choose, then a short summary, then the whole county in detail.
- Household debt. Debt in collections, credit card holders behind, auto and retail loans behind, mortgages 30 to 89 days past due and mortgages 90 or more days past due.
- Bankruptcy, poverty and income. Bankruptcy filings per 100,000 people, people below the poverty line and median household income.
- Rent and home values. HUD’s two-bedroom rent limit, a year of rent as a share of home value, and the typical home value in each part of the town.
- Jobs. The unemployment rate.
- Household costs. The electricity bill for an average home and a month of groceries on the USDA Thrifty Food Plan for a family of four.
- Natural hazards and crime. Natural hazard risk and flood insurance, and the violent crime rate.
- Health. CDC model-based estimates of adults with frequent poor mental health, adults with frequent poor physical health, and adults ever told they have depression.
- One city or town. A section on one city or town in the county that you choose, with its own figures (the sample’s is Youngstown city).
The report sets the county’s figure beside the state and the U.S. where those exist, with recent readings. The town section sets the town beside its county, and a few sections show the county alone. Every figure carries the date and source of its data. Sentences you can quote come with their source and period.
Made for the decision you’re making
- Investors see where a county is losing people. Mahoning County’s population has shrunk every year since 2020.
- Lenders watch borrower stress over time. In the sample, the share of adults with debt in collections rose from 27.6% in Aug 2025 to 28.9% in Aug 2026.
- Agents show clients the numbers behind the price. In the sample’s town map, the typical home is worth $120,300 in Kirkmere and $20,300 in Hazelton and Downtown.
Prices
- County report plus one city or town $29
The full county report, plus one city or town in the county that you choose.
Coming
- Lite plan
- Pro plan
- Pro Plus plan
Custom work? Contact us.
Sources include: U.S. Census Bureau, U.S. Bureau of Labor Statistics, U.S. Department of Housing and Urban Development, Federal Emergency Management Agency, Consumer Financial Protection Bureau, Centers for Disease Control and Prevention, U.S. Bureau of Economic Analysis, Federal Bureau of Investigation, Urban Institute.
Each report is built when you order it, from the latest data we hold.
American Default Research, 8264 Olmstead Lane SE, STE 1308, Snoqualmie, WA 98065-9998.